
Research
How to Backtest on MT4: A Simple Blueprint for Flawless EA Validation
Dec
To backtest on MT4, you must use the platform’s integrated Strategy Tester to simulate your Expert Advisor (EA) against historical price data, allowing you to evaluate its performance before risking real capital. This process involves selecting your EA, configuring specific test parameters such as the currency pair, timeframe, and data accuracy model, and then running the simulation. The final step is to analyze the generated report, which provides detailed statistics on profitability and risk. This blueprint is designed to guide you through each stage for a thorough and reliable validation of your automated trading strategy.
Understanding the core components of backtesting is the first step toward mastering the process. This involves recognizing the roles of the Strategy Tester, the Expert Advisor, and the historical data you use. The Strategy Tester is the engine that runs the simulation, while the Expert Advisor contains the trading logic being tested. The quality of your historical data forms the foundation of the entire test, as inaccurate or incomplete data will produce unreliable and misleading results. A solid grasp of these elements is essential for a meaningful test.
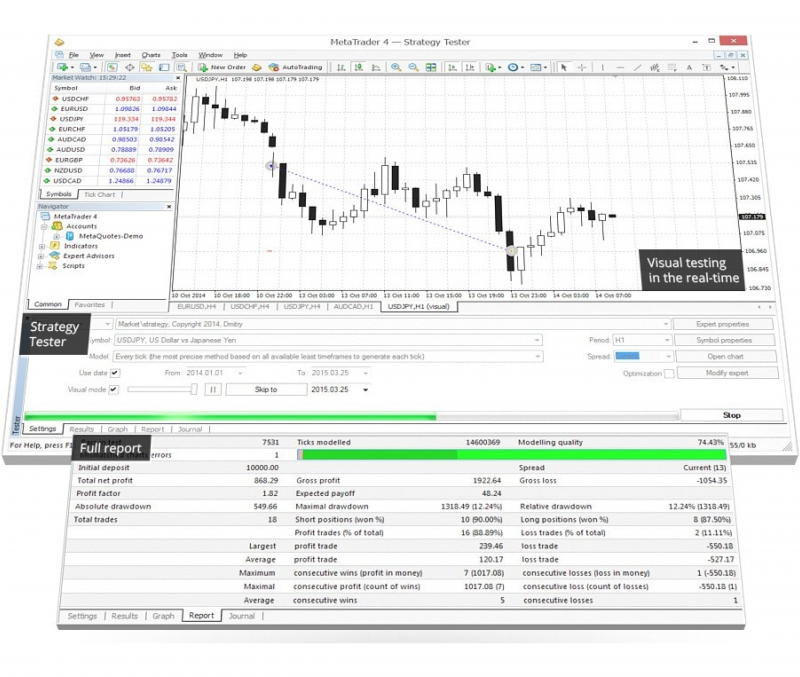
Analyzing the backtest report correctly is just as important as running the test itself. The report generated by MT4 contains a wealth of information that reveals the strengths and weaknesses of your Expert Advisor. Key metrics like Total Net Profit, Profit Factor, and Maximal Drawdown provide a statistical snapshot of performance. Learning to interpret these numbers will allow you to objectively determine if an EA is potentially profitable, too risky, or requires further optimization. This analysis is the key to flawless EA validation.
This guide provides a straightforward method for conducting and interpreting backtests within the MT4 platform. By following these steps, you will gain the skills to test any Expert Advisor with confidence, helping you make more informed decisions in your automated trading journey. Let’s begin by defining what backtesting means within the MT4 environment.
What is Backtesting in the Context of MT4?
Backtesting in MT4 is the process of simulating a trading strategy, known as an Expert Advisor (EA), on historical price data to evaluate its potential profitability and risk. This simulation recreates past market conditions, allowing the EA to execute trades as if it were operating in real time. The primary purpose is to see how a strategy would have performed in the past, offering insights into its potential future performance without risking any actual money. The entire process relies on three root attributes: the Strategy Tester, quality Historical Data, and the Expert Advisor itself.
To understand this process better, we need to examine the specific tools and requirements involved. The MT4 platform provides a dedicated environment for this task, and the quality of your inputs directly impacts the quality of your results.

What Role Does the Strategy Tester Play in MT4?
The Strategy Tester is the dedicated, built-in module within the MetaTrader 4 platform specifically designed for testing and optimizing Expert Advisors and custom indicators. Think of it as a financial laboratory where you can safely experiment with automated trading strategies. Its core function is to run an EA over a specified period of historical price data, executing trades based on the EA’s pre-programmed logic. It meticulously records every action, from opening a trade to closing it, calculating the resulting profit or loss along the way.
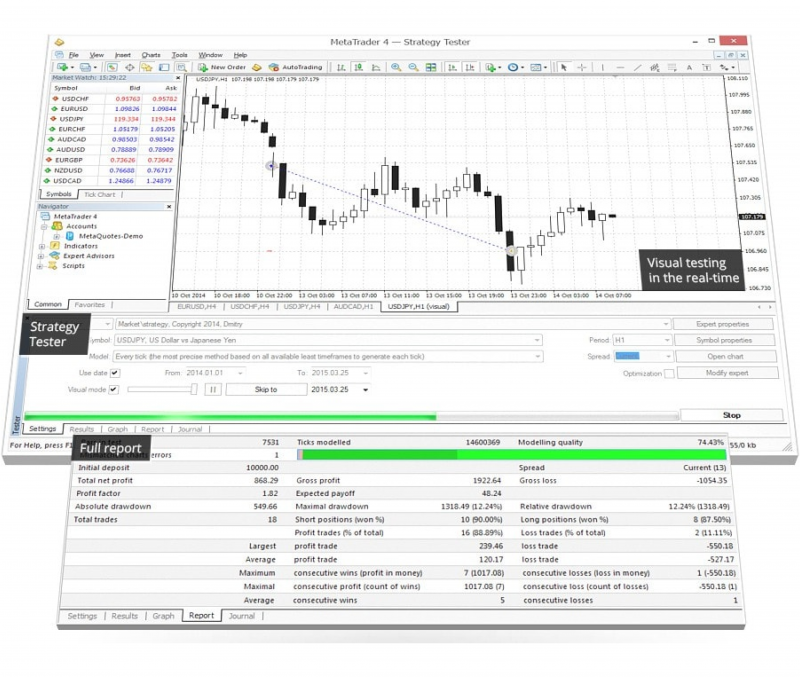
Cụ thể hơn, the Strategy Tester serves several functions that are central to the backtesting process. First, it provides the user interface for setting up the test. Here, you select which EA to test, the financial instrument (like EURUSD), the timeframe (like H1), and the date range. You can also control the quality of the simulation through different modeling methods. Second, it is the engine that processes the historical data tick by tick or bar by bar, feeding this information to the EA. The EA then reacts to this data just as it would in a live market. Finally, after the simulation is complete, the Strategy Tester compiles all the trade data into a detailed report and a visual graph, which are used to analyze the EA’s performance.
Is Quality Historical Data Necessary for an Accurate Backtest?
Yes, quality historical data is absolutely necessary for an accurate backtest because the reliability of the test results directly depends on the accuracy and completeness of the data used. The fundamental principle of “Garbage In, Garbage Out” (GIGO) applies perfectly here. If the historical data is flawed, incomplete, or inaccurate, the backtest simulation will be based on unrealistic market conditions. Consequently, the performance report will be misleading, potentially making a failing strategy appear profitable or a good strategy appear weak.
Để minh họa, consider the impact of poor data. If your historical data has large gaps or missing bars, your EA will not be able to react to price movements that occurred during those times, leading to an incomplete picture of its performance. Inaccurate price spikes or bad ticks in the data can trigger trades that would never have happened in reality, skewing the profit and loss calculations. Furthermore, using data with a fixed spread when the actual market has a variable spread can hide the true cost of trading, making the EA seem more profitable than it is. High-quality data, with a 99.9% modeling quality, includes real tick data and variable spreads, providing a much more realistic simulation of historical market behavior and, therefore, a more trustworthy backtest result.
What Are the Steps to Perform a Backtest on MT4?
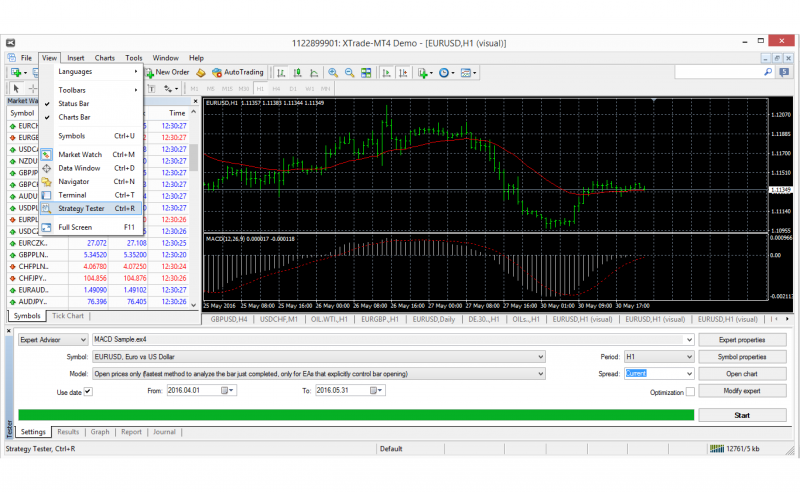
To perform a backtest on MT4, you use the Strategy Tester module to select an Expert Advisor, configure key parameters like the currency pair and timeframe, and run the simulation on historical data. This structured process allows for a methodical evaluation of an EA’s performance. You can access the Strategy Tester by clicking the “View” menu and selecting “Strategy Tester” or by pressing the keyboard shortcut Ctrl+R. Once the panel appears at the bottom of your screen, you can begin configuring the test environment to match your desired conditions. The entire procedure is designed to be systematic, moving from general settings to specific EA inputs before starting the test.
Here is a step-by-step breakdown of the process to ensure you set up your test correctly and efficiently.
What Are the Key Parameters to Configure in the Strategy Tester?
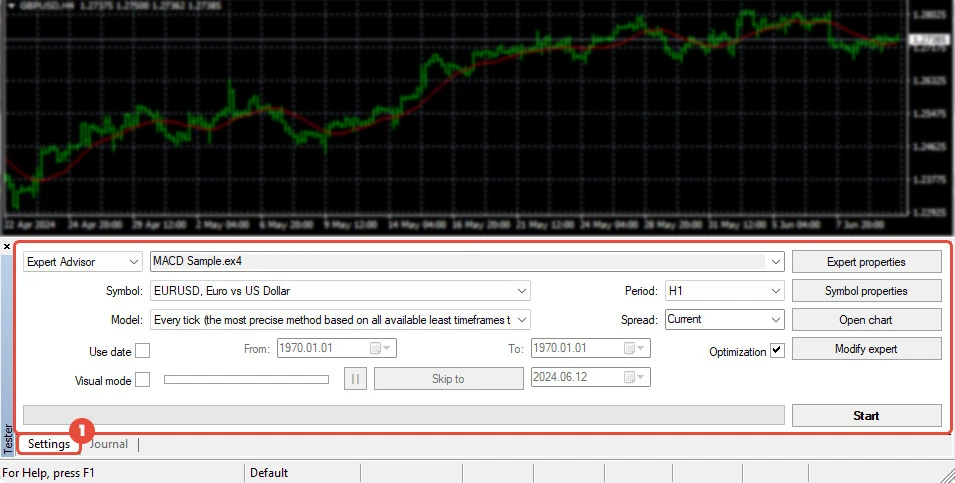
The key parameters to configure in the Strategy Tester include the Expert Advisor, Symbol, Model, Use date, Visual mode, Period, and Spread. Each of these settings defines a critical aspect of the simulation environment and must be set correctly to produce a meaningful and accurate test. These settings are found directly in the main “Settings” tab of the Strategy Tester window.
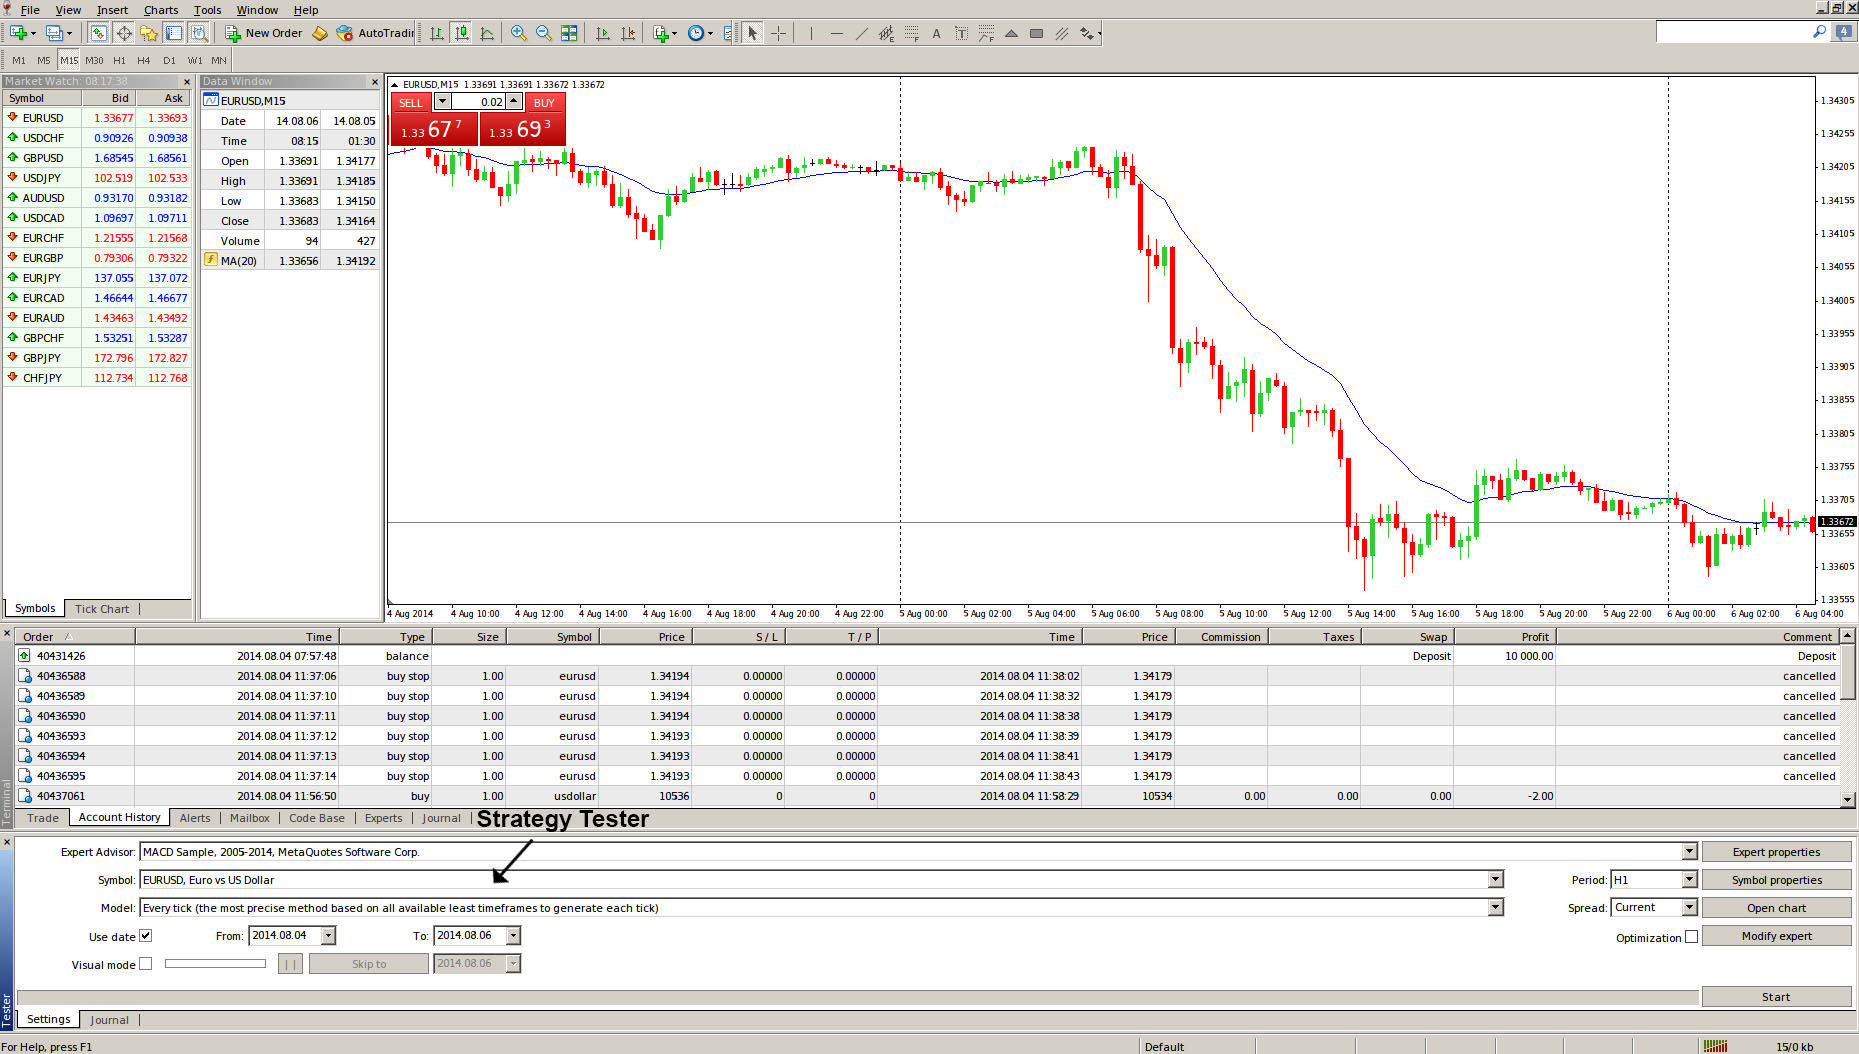
Here is a detailed explanation of each parameter:
- Expert Advisor: This dropdown menu is where you select the automated trading strategy (the .ex4 file) that you wish to test. All installed EAs will appear in this list.
- Symbol: This allows you to choose the financial instrument for the test, such as a currency pair like EURUSD, a commodity like Gold (XAUUSD), or an index.
- Model: This setting determines the method used to generate ticks within the historical data, which directly impacts the accuracy of the simulation. There are three options: “Every tick” is the most precise method, as it simulates every real tick, but it is also the slowest. “Control points” is less precise but faster. “Open prices only” is the fastest but least accurate, as it only uses the open price of each bar. For serious testing, “Every tick” is recommended.
- Use date: This checkbox allows you to specify a custom date range for your backtest. If you uncheck it, the test will run on all available historical data for the chosen symbol.
- Visual mode: Checking this box opens a new chart that shows the EA’s trades being executed in real-time on the historical data. A slider allows you to control the speed of the simulation. This is useful for debugging and understanding how your EA behaves, but it slows down the process considerably.
- Period: This dropdown sets the chart timeframe for the backtest, such as M1 (1-minute), H1 (1-hour), or D1 (1-day). The EA will operate based on the bars of this chosen timeframe.
- Spread: This allows you to set the spread in pips for the simulation. You can choose “Current” to use the current market spread, or you can select a fixed value. Using an average fixed spread for the chosen pair is a common practice for consistency.
How Do You Adjust an EA’s Input Parameters for a Test?
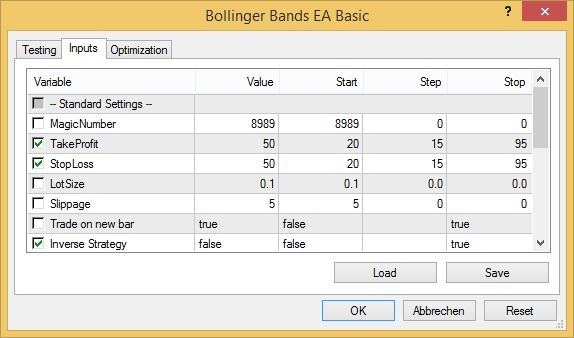
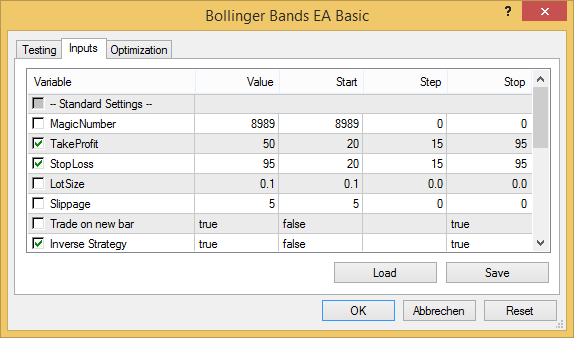
You adjust an EA’s input parameters by clicking the “Expert Properties” button in the Strategy Tester, selecting the “Inputs” tab, and then modifying the values for variables like Stop Loss or indicator settings. This feature is what allows you to test different versions of your strategy without changing the source code. The “Inputs” tab displays all the external variables that the EA’s developer has made available for user customization. This is where you can fine-tune the strategy to find the optimal settings for a particular market or timeframe.

The process is straightforward. First, after selecting your EA in the Strategy Tester, click the “Expert Properties” button located on the right side. A new window will pop up. Navigate to the “Inputs” tab within this window. You will see a list of parameters organized into three columns: Variable, Value, and Step. The “Variable” column shows the name of the parameter (e.g., `TakeProfit`, `LotSize`, `MagicNumber`). The “Value” column is where you make your changes. To modify a setting, simply double-click its corresponding cell in the “Value” column, type in your new desired value, and press Enter. For example, you could change the `StopLoss` value from 50 to 75. After you have adjusted all the necessary parameters, click the “OK” button to save your changes and close the window. These new settings will now be used when you click the “Start” button to run the backtest.
How Do You Analyze an MT4 Backtest Report?
You analyze an MT4 backtest report by examining the key statistical metrics in the “Report” tab, such as Profit Factor and Maximal Drawdown, and by observing the equity curve in the “Graph” tab to assess performance consistency. Merely running a backtest is not enough; the real validation comes from a careful and objective interpretation of the results. The MT4 Strategy Tester provides several tools to help with this analysis. A successful analysis involves looking beyond the total profit and digging into metrics that reveal the risk, consistency, and overall health of the trading strategy.
Let’s break down how to interpret these results to validate your EA. By understanding what each metric means and how the visual graph complements the raw data, you can form a complete picture of the EA’s historical performance.
What Do Profit Factor and Maximal Drawdown Mean in a Backtest Report?
Profit Factor is a performance metric that measures the ratio of total profit to total loss, while Maximal Drawdown represents the largest percentage decline in equity from a peak to a subsequent trough. These two metrics are among the most important for evaluating an EA’s performance because they provide a quick snapshot of profitability relative to risk. They help answer two critical questions: How much does the strategy make for every dollar it loses? And what was the worst losing streak the account experienced?

Cụ thể hơn, the Profit Factor is calculated by dividing the gross profit by the gross loss. A value greater than 1 indicates that the strategy is profitable. For instance, a Profit Factor of 2.0 means the EA made $2 for every $1 it lost. Generally, a Profit Factor above 1.5 is considered good, while anything below 1.2 might suggest the strategy is not robust enough to cover costs in live trading. Maximal Drawdown, on the other hand, is a key indicator of risk. It shows the largest drop in your account’s equity. A lower drawdown percentage is always preferable. For example, a Maximal Drawdown of 50% means that at one point, your account was down by half from its previous peak. Many traders aim for strategies with drawdowns below 20-25%, as high drawdowns can be psychologically difficult to endure and increase the risk of ruin.
How Does the Graph Tab Differ from the Report Tab in Analyzing Results?
The Graph tab provides a visual representation of your account’s balance and equity growth over time, while the Report tab offers precise numerical statistics and a detailed trade list. Both tabs are essential for a complete analysis, but they serve different purposes. The Graph allows for a quick, intuitive assessment of the strategy’s performance, while the Report provides the hard data needed for a deep, quantitative evaluation. Using them together gives you a holistic view of the EA’s behavior.

Let’s see how they compare. The Graph tab plots two lines: a blue line representing the account balance and a green line representing the account equity (balance plus floating profit/loss of open positions). An ideal graph shows a smooth, consistently rising curve from the bottom-left to the top-right corner. A volatile, jagged curve, even if it ends in profit, indicates a high-risk strategy with significant swings. In contrast, the Report tab is purely numerical. It presents a summary of key metrics like Total Net Profit, Profit Factor, Maximal Drawdown, total trades, and win rates. It also provides a complete history of every single trade executed during the test. You use the Report to confirm the exact figures behind the visual trends you see in the Graph, allowing you to validate the EA with statistical confidence.
What Are the Advanced Methods for Ensuring a Flawless and Realistic EA Validation?
To achieve a flawless and realistic EA validation, traders must use high-quality tick data, combine backtesting with forward testing, understand platform differences, and actively avoid common analytical mistakes. These advanced techniques move beyond the simple process of running a strategy test and focus on creating a simulation that mirrors live trading conditions as closely as possible. By adopting these methods, you can gain a much more accurate picture of an Expert Advisor’s potential performance and weaknesses. Let’s explore what separates a basic test from a truly rigorous one.
What is the Difference Between 99.9% Modeling Quality and Standard MT4 Backtests?
The most significant difference lies in the data used to simulate price movements. A 99.9% modeling quality backtest uses genuine tick-by-tick data, simulating every price change, whereas a standard MT4 backtest generates artificial ticks based on higher timeframe data. This distinction is fundamental to the accuracy of the results. In a standard test, the platform might only use the open, high, low, and close prices of a one minute candle to guess how the price moved within that minute. This method completely misses the actual price path and the volatility that occurred between those points. For EAs that trade on small timeframes, like scalpers, this inaccuracy can produce highly misleading positive outcomes because the simulated environment is much smoother than reality.
Achieving 99.9% modeling quality requires using third party software and sourcing real tick data from a reliable broker. This process reconstructs the market with precision, including variable spreads that widen and tighten just as they do in a live market. You’ll notice the backtest report shows this specific quality level, confirming its reliability.
Here are the key points of contrast:
- Data Source: Standard tests use interpolated data from MT4’s history center. A 99.9% quality test uses imported tick data from external sources.
- Price Simulation: Standard tests create a simplified, unrealistic price path. A 99.9% test recreates the exact historical price path, tick by tick.
- Accuracy: The results from a standard test can be unreliable. The outcomes from a 99.9% test provide a much more dependable forecast of an EA’s behavior.
Backtesting vs. Forward Testing: Which is Better for Preventing Curve-Fitting?
Neither method is superior on its own for preventing curve-fitting; the most robust approach is to use backtesting to develop a strategy and then use forward testing to validate it on unseen data. Curve-fitting, also known as over-optimization, happens when an EA’s parameters are tuned so perfectly to historical data that it fails to adapt to new, live market conditions. The EA has memorized the past instead of learning a durable trading logic. Backtesting is the process of testing a strategy on a historical dataset. It is fast and allows you to analyze years of data in a short period. However, it is highly susceptible to curve-fitting because you can endlessly tweak settings to find the best possible result for that specific period.
Forward testing, on the other hand, involves running the EA on a demo or small live account in real time. The EA trades on new price data as it becomes available. This is the ultimate test of whether a strategy’s logic is sound or simply the product of over-optimization.
Combining these two methods creates a powerful validation workflow:
- Step 1 Backtesting: Use historical data to identify promising strategies and filter out those that are clearly unprofitable. This is your initial screening phase.
- Step 2 Optimization: Cautiously optimize the EA’s main parameters on one portion of the historical data.
- Step 3 Forward Testing: Run the optimized EA on a demo account for several weeks or months. If it performs as expected on this new data, you have strong evidence that it is not curve-fit.
How Does Backtesting on MT4 Compare to Backtesting on MT5?
The backtesting environment in MT5 is fundamentally more advanced and powerful than in MT4. MT5 offers multi-currency testing, superior processing speed, and more realistic market simulations out of the box, while MT4’s tester is simpler and more limited. The architecture of MT5 was designed with sophisticated testing in mind. As a 64 bit, multi-threaded platform, MT5 can utilize multiple CPU cores to complete complex backtests far more quickly than the single core, 32 bit MT4 platform. This speed is especially noticeable when testing over long periods or with complex EAs.
A standout feature in MT5 is the ability to test strategies that trade multiple currency pairs or assets at the same time. This is impossible in MT4, which can only backtest a single instrument at once. For traders developing portfolio-based strategies, this makes MT5 the only viable choice. MT5 also has improved native support for simulating real-world conditions, such as using real tick data and accounting for exchange-specific execution rules.
Here is a summary of the main differences:
- Speed and Performance: MT5 is significantly faster due to its 64 bit, multi-threaded architecture.
- Multi-Asset Testing: MT5 can test strategies across multiple instruments simultaneously; MT4 cannot.
- Data Accuracy: MT5’s Strategy Tester provides a more accurate simulation using real ticks with less reliance on third-party tools.
- Reporting: The analysis reports generated by MT5 are more detailed, offering deeper insights into an EA’s performance metrics.
What are the Most Common Backtesting Mistakes to Avoid?
The most frequent backtesting errors are using low-quality historical data, ignoring trading costs like spread and slippage, over-optimizing the EA’s settings, and testing on an insufficient timeframe. These mistakes can lead to a false sense of confidence in an EA that is destined to fail in a live trading environment. Avoiding them is a large part of achieving a realistic validation. A backtest is only as good as the data and conditions it is based on. If these inputs are flawed, the output will be meaningless.
Let’s look at what to avoid to get more reliable results:
- Ignoring Trading Costs: Many traders run backtests with a fixed, low spread and no slippage. In reality, spreads are variable and slippage occurs, especially during volatile news events. Always use a variable spread that reflects your broker’s typical conditions and add a commission if applicable.
- Over-Optimization: This is the classic curve-fitting error. It involves tweaking parameters until the EA shows a perfect equity curve on past data. A strategy should be robust enough to work with a range of settings, not just one “magic” combination.
- Using Insufficient Data: Testing an EA over just a few months of data is not enough. The data should span several years to see how the strategy performs in different market conditions, including uptrends, downtrends, and sideways markets.
- Misinterpreting the Results: Focusing only on the total profit is a common error. A proper analysis involves examining the maximum drawdown, profit factor, win rate, and the shape of the equity curve to assess the risk and consistency of the EA.
