
Research
EA Drawdown Explained: Mastering Peak-to-Trough Decline for Risk Management
Dec
EA drawdown is the measurement of an account’s equity decline from a peak value to a subsequent low point, serving as a primary indicator of an Expert Advisor’s inherent risk and volatility. This peak-to-trough measurement reveals the largest loss an automated trading strategy has experienced in its history. Rather than focusing on individual losing trades, it shows the cumulative impact of a losing streak on the account’s capital. A high drawdown suggests the EA takes on substantial risk, which might lead to large profits but also carries the potential for deep, uncomfortable losses.
The role of drawdown in EA risk management is to offer a realistic gauge of potential losses, guide capital preservation efforts, and align the EA’s behavior with a trader’s psychological comfort level. While a high win rate seems attractive, it can be misleading if the few losing trades are large enough to wipe out many small wins. Drawdown provides a clearer picture of the potential pain an EA can inflict. This information helps traders choose EAs that match their risk tolerance and decide on appropriate lot sizes to survive the inevitable losing periods without losing their entire investment.
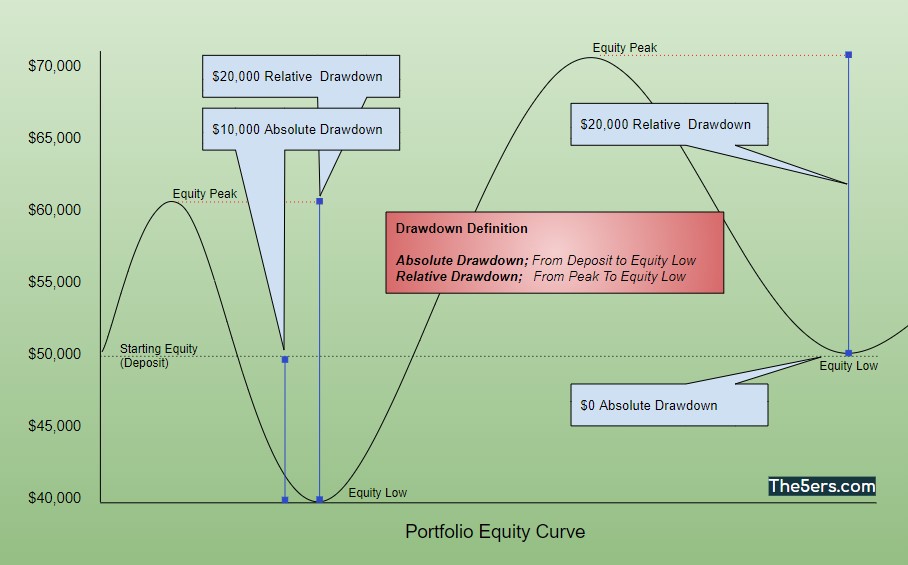
The three key types of drawdown that traders analyze are Maximal Drawdown, Relative Drawdown, and Absolute Drawdown. Each metric provides a unique perspective on the EA’s risk profile. Maximal Drawdown shows the single worst loss from a high point in the account’s history, representing the worst-case scenario observed. Relative Drawdown expresses this as a percentage, making it easy to compare the risk of different EAs. Absolute Drawdown measures how far the account fell below the initial deposit, which is a direct reflection of risk to the starting capital.
Understanding these concepts is foundational for any trader using automated systems. By analyzing drawdown, you move beyond simple performance metrics and gain a deeper appreciation for an EA’s true character and risk profile. Let’s explore these elements in greater detail.
What is EA Drawdown?
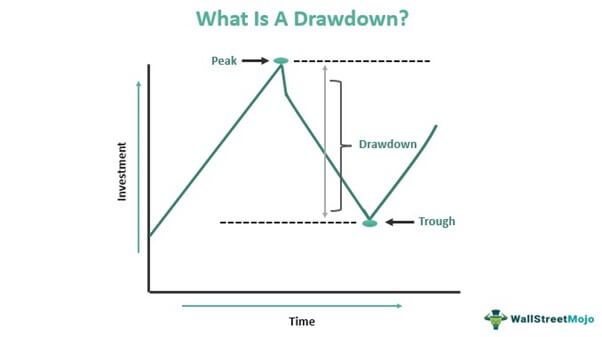
EA Drawdown is the measurement of an account’s equity decline from a peak value to a subsequent low point, serving as a primary indicator of an Expert Advisor’s inherent risk and volatility. It is not a single loss but rather the total reduction in capital from a high water mark until a new high is achieved. Imagine your trading account as a mountain climber’s ascent. The highest point reached is the equity peak. Any downward movement from that peak is a drawdown. The lowest point reached during that descent, before the climber starts ascending again to a new, higher peak, is the equity trough. The total vertical distance from that peak to that trough is the drawdown.
To understand drawdown fully, we can break it down into its core attributes.

First is its Definition as a peak-to-trough decline. This is the most accurate way to view it. It captures the full impact of a series of losing trades or a few very large losing trades. For instance, if your account grows from $10,000 to $15,000 (the peak) and then falls to $12,000 (the trough) before recovering, the drawdown is $3,000. It doesn’t matter if this happened over five small losses or one big one; the total impact on your peak equity is what counts. This metric shows you the system’s resilience and its potential for recovery.
Next is its function as a measure of Risk. A high drawdown percentage indicates a high-risk strategy. An EA with a historical drawdown of 50% means that, at one point, it lost half of its peak value. Are you prepared for your account to be cut in half? This question is central to risk management. Drawdown gives you a tangible number to work with, allowing you to quantify the potential pain of using a specific EA. It provides a more practical view of risk than theoretical metrics because it represents what has actually happened in the past.
The Equity Peak is the highest point your account’s equity has ever reached. This includes the value of all open positions. Every time your account value surpasses its previous all-time high, a new equity peak is established. This is the reference point from which all subsequent drawdowns are measured. It is the “summit” from which any descent begins.
Finally, the Equity Trough is the lowest point your account equity reaches after a peak has been set. This trough continues until the EA’s performance recovers and eventually surpasses the previous peak. The distance between the peak and this trough defines the magnitude of the drawdown. Identifying these troughs is essential for calculating the historical performance and understanding the rhythm of the EA’s profit and loss cycles.
What is the Role of Drawdown in EA Risk Management?
The role of drawdown in EA risk management is to provide a realistic measure of potential loss, guide capital preservation strategies, and align the EA’s performance with a trader’s psychological tolerance for risk. It shifts the focus from simple metrics like win rate to the more telling aspect of capital survivability. A system with a 90% win rate might seem excellent, but if the 10% of losses create a 50% drawdown, it is a much riskier system than one with a 60% win rate and only a 15% drawdown. Drawdown exposes the true character of an EA’s risk exposure.
To see why this is so important, let’s look at its specific functions in risk management.
Drawdown is a superior metric for assessing an EA’s viability because it directly addresses Capital Preservation. The first rule of trading is to protect your capital, and drawdown shows you how well an EA has done this in the past. It answers the question: “What is the worst historical losing streak I might have to endure?” Knowing this allows a trader to set aside appropriate capital and use position sizing that can withstand such a downturn. If an EA has a 30% maximum drawdown, using too much leverage could easily lead to a margin call during a similar future event.
Furthermore, drawdown is fundamental for managing Psychological Tolerance. Every trader has a point at which seeing their account balance decrease becomes emotionally unbearable, leading to poor decisions like manually closing trades or disabling the EA at the worst possible time. An EA’s historical drawdown provides a preview of the emotional stress it might cause. If you know you cannot stomach a 40% drop in your account, you should not use an EA that has historically shown a 40% drawdown, no matter how profitable it seems. It helps you find a strategy that you can stick with through its full cycle, both good and bad.
How is Peak-to-Trough Drawdown Calculated?
The calculation for peak-to-trough drawdown is based on a straightforward formula that measures the percentage drop from the highest equity point to the subsequent lowest equity point. This formula is: Drawdown % = ((Peak Equity – Trough Equity) / Peak Equity) * 100. This percentage provides a standardized way to compare the risk of different EAs, regardless of the account size they were tested on. It quantifies the severity of a losing period in relative terms, making it one of the most useful metrics in any performance report.
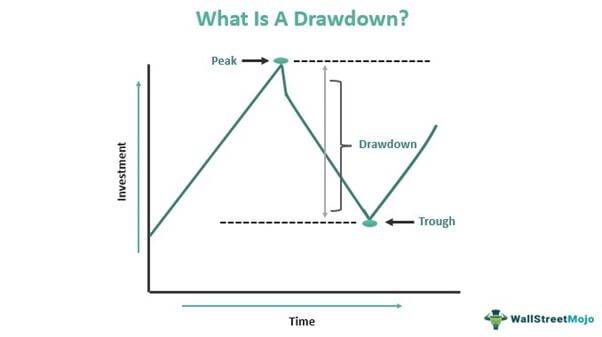
To illustrate how this calculation works, let’s use a simple numerical example. Suppose you start with a trading account of $10,000. Your EA performs well, and over several weeks, your account equity, including floating profits, grows to a new high of $18,000. This $18,000 is your new Peak Equity. Following this peak, the EA enters a losing period. A series of losing trades causes your account equity to fall. The lowest point it reaches during this downturn is $13,500. This is the Trough Equity. After hitting this low, the EA starts winning again and your account begins to recover.
To calculate the drawdown for this period, you would use the formula:
- Peak Equity: $18,000
- Trough Equity: $13,500
- Drawdown in dollars = $18,000 – $13,500 = $4,500
- Drawdown % = (($18,000 – $13,500) / $18,000) * 100
- Drawdown % = ($4,500 / $18,000) * 100
- Drawdown % = 0.25 * 100 = 25%
In this example, the drawdown was 25%. This means that during its worst period of performance, the EA lost 25% of the account’s value from its highest point. This single number tells you a great deal about the risk involved. It helps you prepare for the possibility of a quarter of your peak account value disappearing temporarily.
Is a Low Drawdown Always Better?
No, a low drawdown is not always better because an extremely low drawdown can indicate a strategy with minimal profit potential; the objective is to find a suitable balance between the risk (drawdown) and the potential reward. While a low drawdown is generally a desirable characteristic as it points to lower risk and a smoother equity curve, context is everything. An EA with a 2% maximum drawdown might sound incredibly safe, but if its annual return is only 3%, it may not be a worthwhile investment of your capital, especially when compared to other low-risk financial instruments. The relationship between drawdown and profit is a classic example of the risk-reward trade-off.
The key is to evaluate drawdown in relation to the EA’s profitability, often measured by the return/drawdown ratio (also known as the Calmar ratio or a similar performance metric). A high ratio is favorable. For example, an EA with a 60% annual return and a 20% drawdown (a 3:1 ratio) is generally preferable to an EA with a 10% annual return and a 5% drawdown (a 2:1 ratio), even though the second EA has a much lower drawdown. The first EA generates more profit for each unit of risk taken.
An overly conservative strategy designed to minimize drawdown might achieve this by using very tight stop-losses, trading with tiny position sizes, or filtering out so many potential trades that it rarely enters the market. While this keeps the account safe, it also stifles growth. Conversely, a highly aggressive EA might show a 100% annual return but come with a 50% drawdown. This level of volatility is unsuitable for most traders, as a single bad run could wipe out a substantial portion of their capital. Therefore, the “best” drawdown level is subjective and depends entirely on your personal risk tolerance and financial goals. A retiree looking for capital preservation will have a very different preference than a young speculator seeking aggressive growth.
What are the Key Types of Drawdown?
There are three key types of drawdown traders analyze in an EA’s performance report: Maximal Drawdown, Relative Drawdown, and Absolute Drawdown, each offering a different perspective on risk. These classifications are standard metrics found in the strategy tester reports of platforms like MetaTrader 4 and MetaTrader 5. By examining all three, a trader can build a multi-dimensional picture of an EA’s risk characteristics. They are not mutually exclusive; instead, they complement one another to inform your risk assessment. One might highlight the worst-case scenario, another the risk to your initial capital, and the third provides a standardized percentage for comparison.
These performance metrics are generated from historical data, either through backtesting on past price data or from a forward test on a live or demo account. A thorough analysis involves looking at these figures over a long period that includes different market conditions, such as trending, ranging, and high-volatility environments. Doing so helps you understand how the EA behaves under stress and whether its drawdown profile is consistent. Let’s explore what each of these types represents.
What Defines Maximal Drawdown?
Maximal Drawdown is defined as the single largest peak-to-trough decline in account equity, expressed in monetary terms, observed during a specific analysis period. It represents the absolute worst loss an account experienced from a high point. If you were to look at an equity curve chart, the Maximal Drawdown would be the longest vertical drop from a peak to a subsequent valley. This metric is often considered the most important single indicator of an EA’s risk because it answers a direct and practical question: “What is the most money this strategy has ever lost in a single losing streak?”
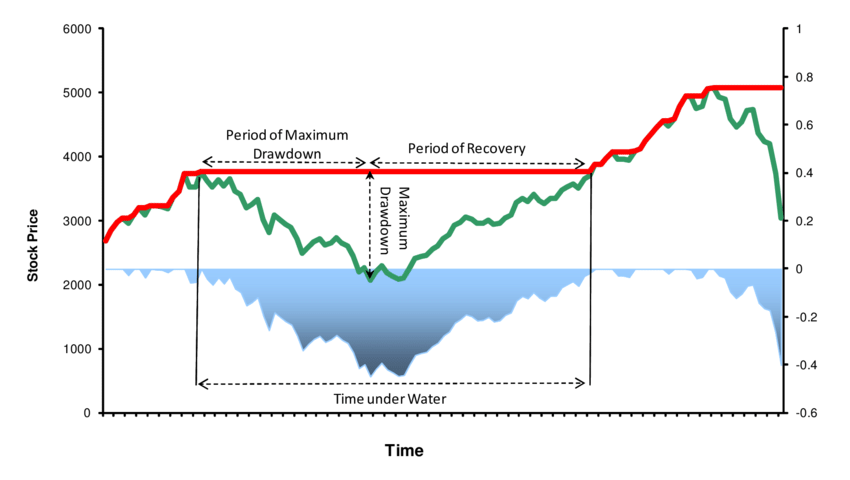
For example, imagine an EA is tested over five years. The account starts at $10,000. It grows to $25,000 (a peak), drops to $20,000 (a $5,000 drawdown), then recovers and climbs to $40,000 (a new peak). After this new peak, it hits a severe losing streak and the equity falls to $28,000 (a trough). This represents a $12,000 drop. The EA then recovers and continues to make new highs. In this entire five-year period, the largest peak-to-trough decline was $12,000. Therefore, the Maximal Drawdown is $12,000. This number gives a trader a concrete expectation of the worst possible financial hit they might have to endure based on historical performance. It is a raw, unfiltered look at the system’s biggest historical failure.
What Defines Relative Drawdown?
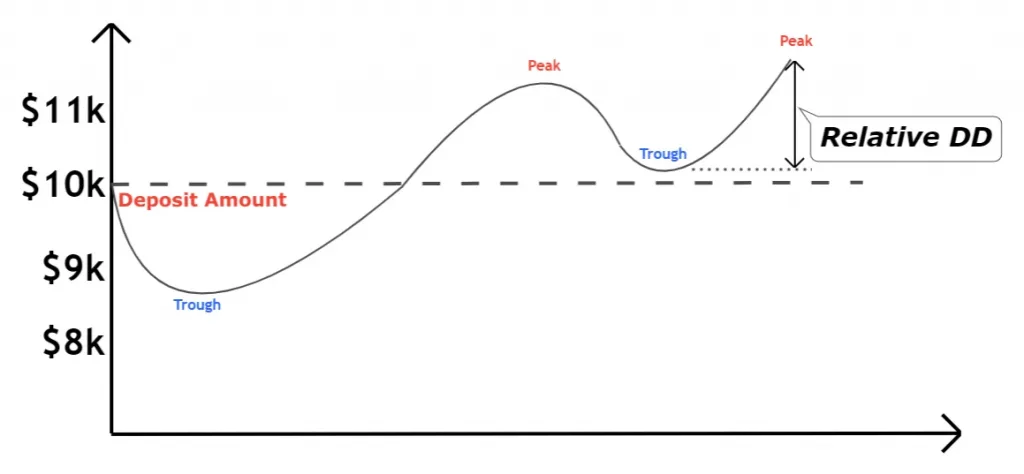
Relative Drawdown is defined as the maximum drawdown expressed as a percentage of the account equity at the time of the peak. It is closely related to Maximal Drawdown but standardizes the figure, making it easier to compare the risk profiles of different EAs. The formula is essentially: (Maximal Drawdown in money / Equity at that Peak) * 100. This percentage remains consistent regardless of the initial deposit size, providing a universal measure of risk. Most trading platforms and performance analyzers prominently feature Relative Drawdown because of its comparative utility.
:max_bytes(150000):strip_icc()/Drawdown_final-c94ef9799eba416485173480a681a70e.png)
Using the previous example, the Maximal Drawdown was $12,000. This drawdown occurred after the account had reached a peak of $40,000. To find the Relative Drawdown, you would calculate: ($12,000 / $40,000) * 100 = 30%. The Relative Drawdown is 30%. This tells you that the EA’s worst historical losing streak wiped out 30% of the account’s value from its peak. This percentage is far more informative than the dollar amount alone. A $12,000 loss on a $1,000,000 account would be minor, but on a $40,000 account, it represents a substantial risk. Relative Drawdown provides this critical context, allowing you to assess if the level of risk is acceptable for your trading plan.
What Defines Absolute Drawdown?
Absolute Drawdown is defined as the difference between the initial deposit and the lowest point the account equity reached below that initial deposit level. This metric focuses exclusively on the risk to your starting capital. If the account equity never drops below the amount you first deposited, the Absolute Drawdown is zero. It is a measure of how much of your original investment was “underwater” at any point. Many conservative traders and investors pay close attention to this figure because their primary goal is the preservation of their initial capital.
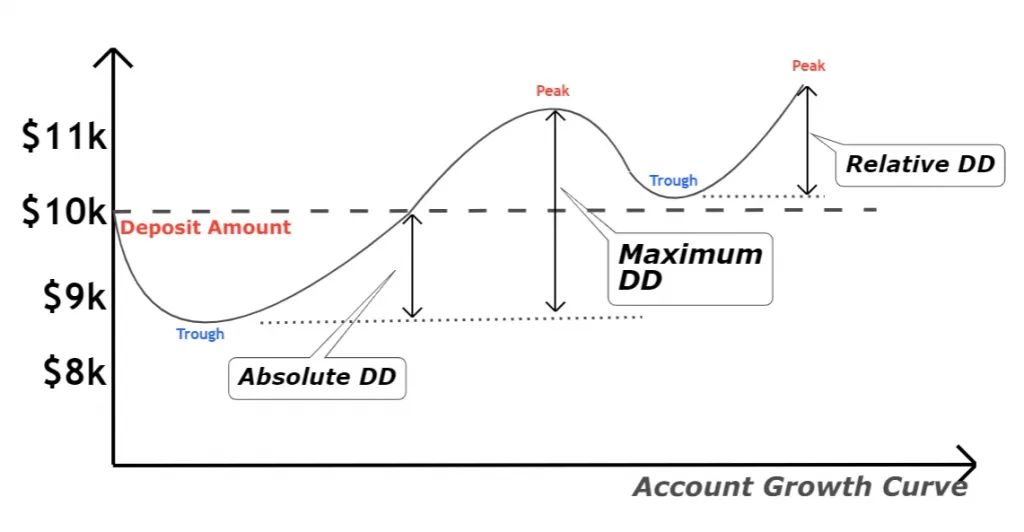
For instance, if you start an account with $10,000, and after some trades, the equity drops to $9,000 before recovering, the Absolute Drawdown registered is $1,000. Even if the account later grows to $50,000 and experiences a $15,000 Maximal Drawdown (down to $35,000), the Absolute Drawdown remains $1,000, because the equity never again fell below the initial $10,000 deposit. This metric becomes a concern only when the EA’s performance is poor enough to eat into the starting funds. An EA that consistently maintains a zero Absolute Drawdown demonstrates a strong ability to protect the trader’s base investment, which can be a very appealing characteristic for risk-averse individuals.
What are Effective Strategies to Control EA Drawdown?
Effective strategies to control EA drawdown include implementing a maximum drawdown stop limit within the trading platform and diversifying the portfolio by running multiple, uncorrelated EAs simultaneously. These methods offer both a hard defensive mechanism and a strategic portfolio-level approach to mitigate risk. Controlling drawdown is not about eliminating losses, which are a natural part of trading, but about keeping those losses within a predefined and acceptable limit. By actively managing drawdown, traders can protect their capital from catastrophic events and reduce the emotional strain that comes with large account fluctuations.
These risk control techniques can be applied in different ways. Some are settings within the EA’s code or the trading platform itself, acting as an emergency brake. Others are related to how you construct your overall automated trading portfolio, using principles of diversification to smooth out returns and reduce volatility. The most robust risk management plans often combine both tactical, system-level controls with broader, strategic portfolio management. Let’s examine two of the most practical and widely used strategies.
How Does Setting a Maximum Drawdown Stop Limit Work?
A maximum drawdown stop limit is a feature in trading platforms or EAs that automatically deactivates the automated strategy or closes all its open positions once a predefined drawdown percentage is reached. It functions as a “circuit breaker” or an ultimate failsafe for your account. This is a hard, rule-based stop that overrides the EA’s normal logic. You, the trader, decide on a drawdown level that represents your maximum pain threshold—for example, 25%. You then configure this setting in your platform (like MetaTrader’s strategy tester or a third-party risk management tool).

If the EA is running and its relative drawdown hits that 25% mark, the failsafe is triggered. The platform will then execute the pre-set action. This could mean it immediately closes all trades opened by that EA and removes the EA from the chart, preventing it from opening any new ones. This action protects the remaining 75% of the account’s peak capital from further losses. This is particularly useful if an EA begins to behave erratically or if market conditions change in a way that its core strategy is no longer viable. It prevents a bad situation from turning into a total account blow-up. The main benefit is disciplined risk control, taking the emotional decision-making out of a stressful situation.
Can Diversifying EAs Reduce Overall Portfolio Drawdown?
Yes, diversifying by running multiple, uncorrelated EAs can reduce overall portfolio drawdown because the losing periods of one strategy may be offset by the winning periods of another, resulting in a smoother combined equity curve. This is the same principle used in traditional investment portfolios, where holding a mix of stocks, bonds, and other assets lowers overall portfolio volatility. The key to successful diversification is low correlation. This means the EAs should trade different strategies, different currency pairs, or different timeframes, so that their performance is not dependent on the same market conditions.
:max_bytes(150000):strip_icc()/maximum-drawdown-mdd.asp-final-861d51b7ffa2482ab4d5e9c0a0e39cc5.png)
For example, you could run one EA that is a trend-following system on GBP/USD and another EA that is a mean-reversion (range-trading) system on AUD/CAD. When the market is strongly trending, the GBP/USD EA will likely perform well, while the AUD/CAD EA may struggle. Conversely, when the market becomes range-bound and choppy, the AUD/CAD EA might generate profits that help offset any losses from the trend-following EA. By combining them, the drawdown of the total portfolio can be less severe than the maximum drawdown of either individual EA. The peaks and troughs of their separate equity curves cancel each other out to some degree, leading to more stable growth and less psychological stress for the trader.
How Does Drawdown Compare to Other Key Performance Metrics?
Drawdown is a primary risk metric that provides context for profitability and recovery metrics, showing the potential downside of an EA’s strategy. By placing it alongside other figures like Recovery Factor and Profit Factor, a trader gains a more balanced view of an Expert Advisor’s performance beyond just total gains. This comparison helps in determining if the potential rewards justify the inherent risks.
What is the Difference Between Drawdown and Recovery Factor?
Drawdown and Recovery Factor offer two opposing views of an EA’s performance: one focuses on the depth of the loss, while the other measures the strength of the rebound. Drawdown quantifies the maximum peak to trough decline in account equity, essentially showing how much money was lost from a high point. A higher drawdown percentage indicates a greater financial and psychological strain during a losing period. It is a direct measure of risk and potential capital erosion. Imagine an EA that turns a $10,000 account into $15,000, then drops to $12,000 before rising again. The drawdown here is $3,000, or 20% of the peak equity.
On the other hand, Recovery Factor gauges how efficiently an EA recovers from its maximum drawdown. It is calculated by dividing the total net profit by the maximum drawdown amount. A high Recovery Factor suggests the EA can generate profits that far outweigh its largest loss. For instance, if an EA made $20,000 in net profit with a maximum drawdown of $5,000, its Recovery Factor would be 4. This indicates a robust system. What this reveals is the relationship between risk and reward.
- Drawdown: A pure risk metric focused on the size of the loss. It answers the question, “How bad can a losing streak get?”
- Recovery Factor: A risk adjusted return metric. It answers the question, “Are the profits worth the largest expected loss?”
- Combined View: A low drawdown is always preferred, but a high Recovery Factor can make a moderate drawdown acceptable, showing the strategy has strong profit generation abilities to overcome setbacks.
How Does the Drawdown of a Martingale EA Differ from a Trend-Following EA?
The drawdown patterns of Martingale and Trend Following EAs are fundamentally different, reflecting their opposing strategic philosophies. A Martingale EA typically exhibits very low, almost flat, drawdown for long periods, which is then punctuated by a single, catastrophic drawdown that can wipe out the account. This happens because the Martingale strategy involves doubling down on losing trades. The goal is that a single winning trade will recover all previous losses plus a small profit. While this works, the account equity curve looks smooth and steadily rising until the market moves persistently against the position, causing a sudden and vertical drop.

Conversely, a Trend Following EA displays more frequent but smaller and more manageable drawdowns. This type of strategy aims to capture profits from sustained market movements. It accepts that many small losses will occur when the market is not trending or when a trend reverses unexpectedly. The equity curve for a Trend Following EA often looks choppy or stair stepped, with regular dips representing these small losses. The strategy’s success depends on a few large winning trades outweighing the many small losing ones. This results in a much different risk experience for the trader.
- Martingale Drawdown Profile: Characterized by long periods of stability followed by a sudden, severe loss. The risk is concealed until it materializes all at once.
- Trend Following Drawdown Profile: Exhibits frequent, smaller drawdowns as part of its normal operation. The risk is more transparent and occurs regularly.
- Trader Psychology: The Martingale style can create a false sense of security, making the eventual large loss psychologically devastating. The Trend Following style requires a trader to be comfortable with frequent small losses.
Can an EA with a High Drawdown Still Be a Good Choice?
Yes, an EA with a high drawdown can potentially be a good choice, but only if its profit potential is proportionally much higher and it aligns with the trader’s personal risk tolerance. A high drawdown figure in isolation is a warning sign, but it does not automatically disqualify an EA. The key is to assess this risk within the broader context of its overall performance, particularly its ability to generate returns and recover from losses. An EA might have a 40% drawdown, which seems high. But if it also has a high Profit Factor (e.g., above 2.0) and a strong Recovery Factor (e.g., above 3.0), it indicates the strategy, while risky, produces enough profit to make those deep troughs worthwhile over the long run.
The decision also heavily depends on the individual trader. What one person considers an unacceptably high drawdown, another might view as a standard part of a high return strategy. Are you comfortable watching your account equity fall by 30% or more, trusting that the system will recover? This requires substantial confidence in the EA’s backtested and live performance data. It also depends on your capital. A trader with a small account may not be able to survive a large drawdown, whereas a trader with a larger, more diversified portfolio might allocate a portion of their capital to such a high risk, high reward system.
- Profit Metrics: Check if a high Profit Factor and Recovery Factor accompany the high drawdown. These numbers provide evidence that the EA’s wins are large enough to compensate for its deep losses.
- Risk Tolerance: Evaluate your own psychological and financial capacity to withstand large equity swings without panicking and intervening.
- Strategy Fit: The high drawdown strategy might be part of a larger portfolio, balanced by other, more conservative strategies.
What is the Relationship Between Backtesting Drawdown and Live Performance Drawdown?
The relationship between backtesting drawdown and live performance drawdown is that of an idealized baseline versus real world results. Backtesting drawdown is almost always lower and more optimistic than the drawdown experienced in live trading. This discrepancy arises because historical tests, no matter how well configured, cannot perfectly replicate the dynamic and often unpredictable conditions of a live market. A backtest is a simulation run on a finite set of historical data under near perfect conditions. It serves as a valuable guide to an EA’s potential risk profile, but it is not a guarantee of future performance.
Several real world factors contribute to a larger drawdown in live trading. For instance, slippage occurs when there is a difference between the expected price of a trade and the price at which the trade is actually executed. Latency, the delay between the signal and the trade execution, can also alter outcomes. Furthermore, variable spreads, which widen during volatile news events, are often not fully accounted for in backtests that use fixed or average spreads. These elements can turn small, winning trades in a backtest into losing trades in a live environment, accumulating to create a deeper drawdown over time.
- Slippage and Latency: Delays and price changes between order placement and execution can negatively impact performance and increase drawdown.
- Variable Spreads: Live broker spreads are not static. They can widen dramatically, increasing transaction costs and affecting the profitability of trades, especially for scalping EAs.
- Data Quality: The historical data used for backtesting might have gaps or errors, or it might not accurately reflect the liquidity conditions of the time, leading to an overly positive simulation.
https://wallstreetmojocms.recurpro.in/uploads/Drawdown_32d651465e.jpg
EA drawdown is the measurement of an account’s equity decline from a peak value to a subsequent low point, serving as a primary indicator of an Expert Advisor’s inherent risk and volatility
ea drawdown explained
