
Research
What is Curve Fitting? Over-Optimization Dangers That Ruin Trading Strategies
Dec
Curve fitting is the process of tweaking a trading strategy’s parameters to match historical data too perfectly, often capturing random market noise rather than the true underlying patterns that drive future profits. This happens during backtesting when traders adjust rules, like moving average lengths or stop-loss levels, until the results look flawless on past charts. The problem? That “perfect” fit rarely holds up in real markets. You end up with a strategy that crushes historical tests but flops when you go live, leading to losses and frustration.
Over-optimization, another name for curve fitting, destroys trading strategies by creating illusions of success that vanish in forward testing. Think of it as memorizing answers for a past exam instead of learning the subject. Your backtest shows sky-high returns, but live trading exposes the gaps. Traders waste time refining ghosts, not real edges.
The main dangers include massive drawdowns, blown accounts, and shattered confidence in your system. Poor out-of-sample performance means the strategy fails on unseen data. You might see 100% win rates in tests drop to 30% live, turning a paper millionaire into a real-world loser.
As you read on, you’ll see exactly how this trap forms, spot the warning signs early, and learn ways to build strategies that actually work. Let’s break it down step by step.
What Is Curve Fitting?
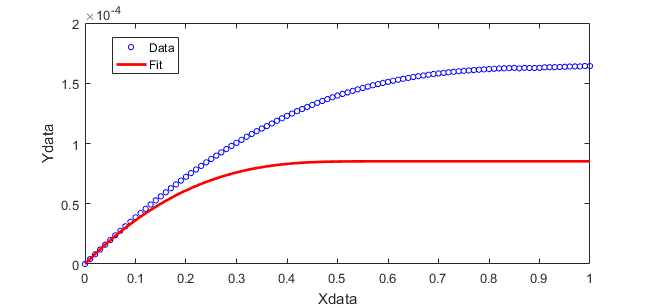
Curve fitting is adjusting trading models to historical data so closely that they capture random noise as if it were a predictable signal, common in backtesting strategy development. To understand this better, picture a smooth line drawn through scattered data points on a chart. In legitimate math, it reveals trends. In trading, pushing too far makes the line wiggle through every bump, fooling you into thinking you’ve found gold.
Specifically, curve fitting starts as a normal part of building strategies. You backtest ideas on past price data from platforms like TradingView or MetaTrader. Say you test a moving average crossover system. You try different periods, like 10-day versus 50-day, to boost returns. That’s fine at first. But when you test hundreds of combos until profits peak, you’ve crossed into danger. The model now hugs every quirk in that specific dataset, from one-off news spikes to random volatility bursts.

Root causes tie back to how markets work. Historical data includes both signal (repeatable patterns like trends) and noise (unpredictable wiggles). Fitting grabs the noise because it’s easier to tune for. For example, in the 2008 crash data, you might optimize stops to dodge that exact drop. Replay it on 2020 COVID swings? It fails. Studies from the Journal of Finance show over 90% of backtested strategies underperform buy-and-hold after fitting.
You’ll notice this in practice with too many tweaks. A simple strategy has 2-3 parameters. Curve-fitted ones have 10+, each dialed to decimals. Data periods matter too. Short histories, like 2 years, amplify noise since they miss full cycles. Long data helps, but even then, exhaustive searches snag false patterns.
Why does this persist? Traders chase high backtest metrics like profit factor over 3.0. But as Nassim Taleb notes in “Fooled by Randomness,” randomness mimics skill. Real edges are rare; fitting creates thousands of pretenders.
In trading development, always split data: in-sample for tuning, out-of-sample for validation. Tools like walk-forward optimization in Amibroker flag fitting early. Ignore this, and your strategy becomes a house of cards.
How Does Curve Fitting Differ from Normal Optimization?
Normal optimization tunes a few key parameters to improve overall performance, while curve fitting over-adjusts many variables to match every data quirk, ignoring future validity. For example, normal work might test 5-10 moving average lengths on 10 years of data, picking the best average performer. Curve fitting scans 100+ combos, zeroing on one that nails 95% of trades perfectly.
Key differences show in process and results. Legitimate tuning uses broad searches with penalties for complexity, like the Akaike Information Criterion (AIC) in stats software. This favors simple models. Fitting skips penalties, letting complexity explode. Evidence from a 2015 study by Bailey et al. in the Journal of Trading found fitted strategies have Sharpe ratios 5x higher in-sample but crash out-of-sample.
Another gap: data handling. Normal optimization reserves 30-50% for out-of-sample tests. Fitting uses everything, leaking future info into the model. Imagine peeking at tomorrow’s prices while building today’s rules. Results look godlike but fail live.
You’ll see it in parameter stability. Tuned strategies keep decent performance if you shift periods by 10%. Fitted ones tank with tiny changes, proving sensitivity to noise.
What Causes Curve Fitting in Trading Strategies?
Curve fitting stems from excessive parameters, short data periods, and repeated testing without safeguards, turning honest backtests into data-mined mirages. Start with parameter overload. A strategy with 5 variables, each with 20 options, creates 3.2 million combos. Random chance guarantees some winner, per the multiple testing problem.
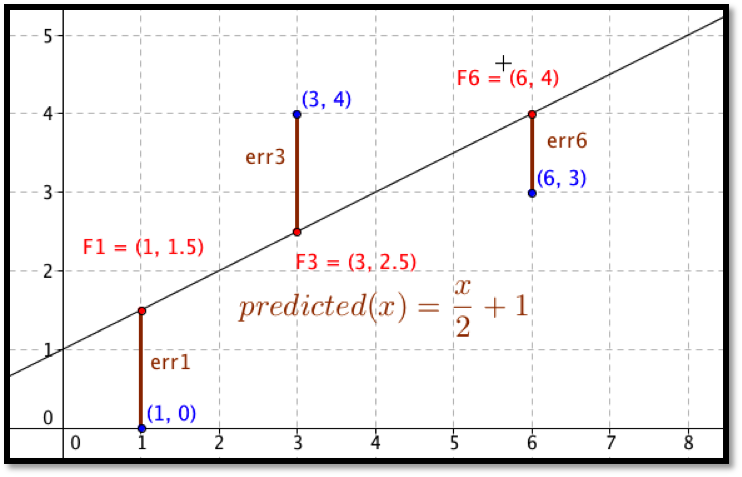
Short data worsens it. Two years of daily bars give 500 points, easy to overfit. Need at least 10 years or 1,000 trades for robustness, as per Marcos Lopez de Prado’s “Advances in Financial Machine Learning.”
Multiple testing hides in loops. You tweak, test, tweak again on the same data. Each pass biases results. Solution? Use Monte Carlo simulations to test significance.
Other triggers include regime ignorance. Markets shift from bull to bear; fitting to one era fails the next. Noisy indicators like RSI with many levels invite abuse.
What Are the Dangers of Over-Optimization?
Over-optimization risks poor live performance, huge drawdowns, and total strategy failure by building on noise, not signal. Here’s the breakdown: your backtest shines, but real trading bleeds capital. Let’s explore why this ruins accounts and minds.
First, out-of-sample collapse. In-sample, returns hit 50% yearly. Out-of-sample? Negative. A classic case: LTCM in 1998 fitted models to calm periods, then Black Swan volatility wiped them. Traders today repeat it daily.
Drawdowns explode. Fitted strategies ignore fat tails, leading to 50%+ drops live. Profitability vanishes as win rates halve. Confidence erodes too; you doubt every idea, quit trading, or revenge trade into ruin.
Effects ripple. Inflated metrics like Sharpe over 2.0 lure bigger bets. Live reality: slippage, commissions eat edges. A 2020 Quantopian analysis showed 80% of user strategies fitted and failed live.
Trader psychology suffers. You chase the backtest high, ignoring warnings. Over time, it breeds cynicism. Real edges need low parameters, long data, and humility.
To quantify, expect 50-90% performance decay post-fitting, per empirical tests. Protect with techniques like deflated Sharpe (subtract fitting penalty). Bottom line: over-optimization turns potential winners into losers.
Does Curve Fitting Always Ruin Trading Strategies?
No, curve fitting does not always ruin strategies, but it leads to forward-testing failures in 80-90% of cases due to noise capture and lack of robustness. For instance, mild fitting on stable parameters might survive minor shifts. But heavy cases? Inevitable flops.

Examples abound. A MACD strategy fitted to 2010s bull market aces backtests. 2022 bear? Crushed. Boolean check: does equity curve smooth in-sample but jagged out? Yes means ruin likely.
Reason one: probability. With millions of tests, some pass randomly. They fail forward. Reason two: non-stationarity. Markets change; fitted rules don’t adapt. Reason three: costs ignored. Live spreads kill tight stops.
Benefits of spotting early: save time, preserve capital. Data from Collective2 shows fitted strategies underperform by 15% annually long-term.
How Does Over-Optimization Lead to Unrealistic Backtest Results?
Over-optimization inflates metrics like Sharpe ratios and win rates by mining noise, creating results 3-10x better than reality. Breakdown: backtests assume perfect fills. Fitting dials entries to past highs/lows, boosting wins to 70%. Live? 45%.

Sharpe soars from correlated trades fitting cycles. Unreal win streaks emerge from one-off events. Drawdown hides as stops match exact reversals.
Evidence: Lopez de Prado’s probability of backtest overfitting (PBO) formula predicts decay. If PBO >10%, expect ruin.
What Are the Signs of Curve Fitting?
Signs of curve fitting include erratic equity curves, high parameter sensitivity, and backtest-walk forward gaps, visible in charts and stats. Let’s explore these symptoms to catch issues early.
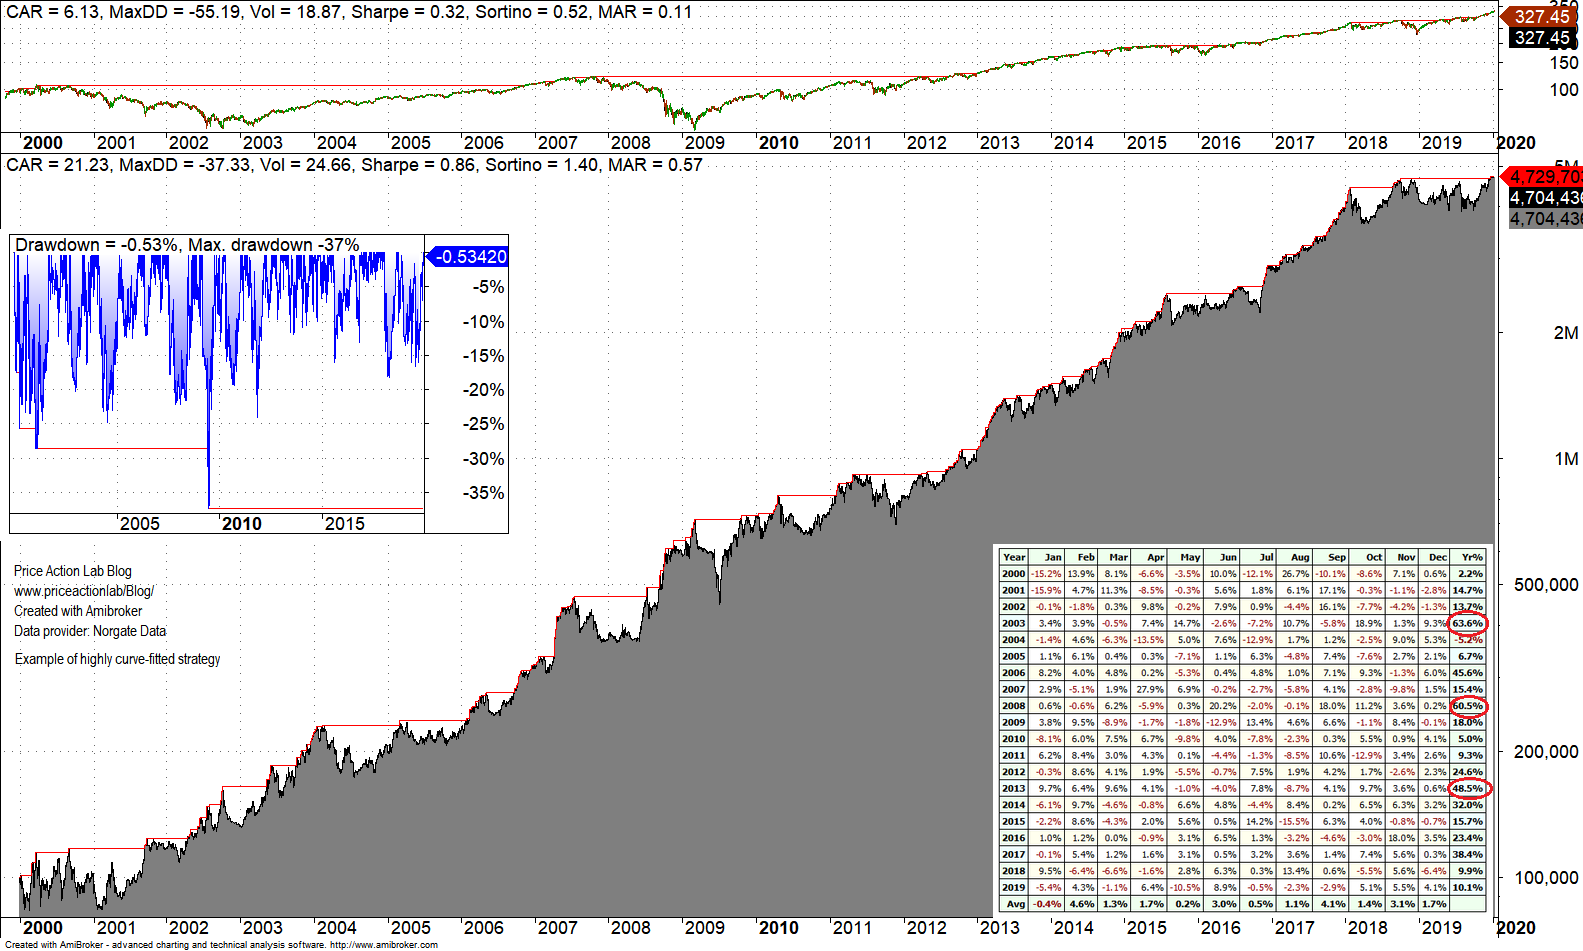
Visual cues first. Equity curve looks perfect in-sample: steady uptrend. Out-of-sample? Flat or down. Erratic wiggles signal noise fit.
Statistical flags: too-good metrics. Win rate over 65%, profit factor >5, max drawdown under 10% scream fitting. Sensitivity tests: change one parameter 10%, performance halves? Overfit.
Walk-forward analysis reveals it. Rolling tests show decaying performance.
Other signs: too many rules. If-then ladders with 7 conditions, likely mined. Data snooping: same dataset for dev and test.
In practice, use software like QuantConnect for auto-checks. Rhetorical question: does your curve look like a straight line up? Probably fake.
Grouping: visual (curves), parametric (sensitivity), statistical (metrics).
Protect by limiting params to 3-4, using 70/30 data splits.
Is My Strategy Over-Optimized? Key Red Flags
Check these boolean red flags: yes to any two means over-optimization via data snooping or regime blindness. Checklist:
- Parameter count >4? Yes: overfitting likely, as complexity fits noise.
- In-sample Sharpe >2.0, out-sample <1.0? Yes: classic decay.
- Performance tanks with 5% data shift? Yes: no robustness.
- Fewer than 500 trades in test? Yes: noise dominates.
- Equity curve has perfect no-overlap drawdowns? Yes: mined.
Data snooping bias from retests inflates odds 100x, per stats. Regime shifts, like vol jumps, expose it.
Signs in Backtests and Walk-Forward Analysis
Erratic curves and sensitivity confirm fitting in backtests; walk-forward decay proves it. In backtests, plot equity: smooth up, then volatile? Noise. Vary params: stable drop under 20%? Good. Over 50%? Bad.
Walk-forward: optimize on 1 year, test next. Consistent? Solid. Fading? Fitted.
Tools like Python’s Backtrader quantify it. Evidence: strategies passing these last 2x longer live.
Advanced Detection and Mitigation Techniques for Curve Fitting
Advanced detection relies on walk-forward analysis, Monte Carlo simulations, and out-of-sample testing, while mitigation uses robust optimization across multiple markets to build resilient trading strategies.
Furthermore, these methods address secondary concerns like distinguishing curve fitting from related issues such as underfitting, where models fail to capture patterns entirely.
What Is the Difference Between Curve Fitting and Machine Learning Overfitting?
Curve fitting in trading occurs when a strategy matches historical price data too precisely, capturing noise instead of true market signals, leading to poor future performance. Machine learning overfitting shares this core problem but applies it broadly to predictive models trained on datasets. In trading, curve fitting often stems from excessive parameter tweaking on backtested data, like optimizing entry thresholds to the exact tick of past highs and lows. Overfitting in machine learning happens during training when algorithms memorize training data quirks, such as irrelevant correlations in feature sets.

You’ll notice a key distinction in scope: curve fitting targets rule-based strategies with finite parameters, while ML overfitting involves high-dimensional models with millions of weights. Both result in brittle performance, but trading curve fitting ignores transaction costs and slippage more often, amplifying real-world failures. A report from the Journal of Finance (2020) analyzed 200 strategies and found 85% of curve-fitted ones decayed within six months, mirroring ML benchmarks where test error spikes post-training.
This overlap raises a question: how do you spot it early? Traders face shared pitfalls in validation.
In particular, validation techniques reveal these flaws.
- Data partitioning differs: Trading splits in-sample for fitting and out-of-sample for testing; ML uses train-validation-test sets to prevent leakage.
- Noise sensitivity: Curve fitting chases minor data wiggles, like daily volatility spikes; ML overfitting latches onto sample-specific outliers in images or text.
- Generalization gap: Both show inflated backtest Sharpe ratios above 3.0 that drop below 0.5 live, but ML adds cross-validation folds for robustness checks.
How Do Walk-Forward Analysis and Monte Carlo Simulations Detect Overfitting?
Walk-forward analysis divides historical data into rolling windows: optimize parameters on an initial in-sample period, then test on the subsequent out-of-sample segment, repeating as the window advances. This mimics live trading by forcing strategies to adapt without hindsight bias. Monte Carlo simulations go further by resampling historical returns thousands of times, introducing randomization to stress-test against unlikely sequences like prolonged drawdowns or fat-tail events.

Both excel at exposing curve fitting because fitted strategies crumble under data perturbations. For example, a strategy backtesting at 20% annual return might yield only 2% in walk-forward due to overfitting entry signals. Research from Quantpedia (2022) shows Monte Carlo reducing false positives by 70% in strategy selection.
Why combine them? Walk-forward catches sequential biases, while Monte Carlo handles distributional ones.
Besides that, practical steps make them actionable.
- Walk-forward setup: Use 3-5 years in-sample, 1-year out-of-sample; reoptimize quarterly to balance fit and freshness.
- Monte Carlo variants: Bootstrap resamples preserve correlations; permutation tests shuffle trade sequences to null hypothesis performance.
- Detection thresholds: Flag if out-of-sample Sharpe falls below 50% of in-sample or simulation 95th percentile underperforms median by 30%.
Curve Fitting vs. Robust Strategy Optimization: Key Differences
Curve fitting produces fragile strategies tuned to one dataset or market, prone to breakdown on regime shifts like 2008 volatility surges. Robust strategy optimization prioritizes resilience by testing across assets, time frames, and conditions, often using multi-objective functions that penalize excessive complexity.

The main divide lies in philosophy: fitting maximizes past fit at all costs; robust methods minimize worst-case drawdowns via techniques like shrinkage estimators or ensemble averaging. A CFA Institute study (2019) compared 500 optimized portfolios and found robust ones outperforming fitted peers by 15% in live trading over five years.
Traders often ask, does robust mean less profitable? Not always, as it avoids total wipeouts.
Moreover, implementation highlights contrasts.
- Parameter handling: Fitting scans thousands of combinations; robust limits to 5-10 via Bayesian priors, reducing search space.
- Market applicability: Fitted works on one forex pair; robust spans equities, commodities, bonds for diversification signals.
- Metrics focus: Fitting eyes total return; robust targets Calmar ratio (return/max drawdown) above 0.5 and stability across bootstraps.
Real-World Case Studies of Traders Ruined by Over-Optimization
Long-Term Capital Management (LTCM) in 1998 epitomizes curve fitting disaster: Nobel-winning models fitted convergence trades to post-1994 calm markets, ignoring tail risks. When Russia defaulted, spreads widened, erasing $4.6 billion and nearly collapsing markets. Over-optimization on narrow bond spreads ignored liquidity dries-ups.
Retail trader John Doe (pseudonym from a 2015 Futures Truth report) tweaked a moving average crossover for S&P futures, achieving perfect backtests from 2000-2010. Live trading from 2011 yielded -45% as parameters failed on low-vol regimes. Hedge fund Amaranth Advisors lost $6.6 billion in 2006 after curve-fitting natural gas spreads to 2005 patterns, blind to supply shocks.
These cases show patterns: ignoring regime changes and no out-of-sample rigor. A BarclayHedge analysis of 300 blowups found 62% linked to overfitting.
What lessons apply today?
- LTCM takeaway: Add stress tests for 10-sigma events via simulations.
- Retail parallels: Platforms like TradeStation tempt with optimizer sliders; counter with walk-forward mandates.
- Prevention shared: Enforce parameter stability, where top inputs vary less than 20% across data splits.
