
Research
Master In-Sample vs. Out-of-Sample Data Testing: Avoid Overfitting Like a Pro

Dec
In-sample testing uses the same data for training and evaluation, which often leads to overly optimistic results, while out-of-sample testing evaluates on unseen data to reveal true model performance and prevent overfitting. This approach helps you build reliable machine learning models that work in the real world. Many beginners stick to in-sample checks and wonder why their models fail later. The key is to master both methods and always prioritize out-of-sample validation.
Overfitting happens when a model learns noise in the training data instead of patterns, causing great in-sample scores but poor results on new data. You spot it through a big gap between training and test accuracy. Switching to out-of-sample testing catches this early.
To avoid overfitting like a pro, combine in-sample for quick checks with out-of-sample for final validation, using techniques like train-test splits and cross-validation. This gives you honest performance estimates before deployment.
Now, let’s break down each concept step by step. You’ll see how to apply them in your projects.
What is In-Sample Data Testing?
In-sample data testing is evaluation on the training data used to fit the model, measuring how well it captures seen patterns but risking overly positive bias. Here’s the breakdown to grasp why it feels good but can mislead.
In-sample testing happens right after you train your model. The model sees the data during fitting, then you score it on that same data. This gives a snapshot of fit, but it’s like testing a student on questions they already studied. Results look strong because the model memorizes details.

Think about a simple case. You have a dataset of house prices with features like size and location. Your regression model learns from all 100 houses. In-sample testing computes error on those 100. Low error? The model fits well there. But does it predict new houses accurately? That’s the catch.
Root issues come from optimism bias. The model tunes to specifics in the training set, including quirks or noise. High in-sample accuracy suggests perfection, yet it hides generalization problems.
How Does In-Sample Testing Work in Model Training?
In-sample testing follows a three-step process: train on data, predict on the same data, and compute metrics like accuracy or MSE. This reveals immediate fit during development.

First, you feed data into the model for training. Algorithms adjust parameters to minimize loss on this set. For a linear regression, it finds the best line through points. In Python with scikit-learn, you call fit(X_train, y_train), then score(X_train, y_train).
Second, generate predictions on the training data. The model outputs estimates for inputs it knows. In classification, like predicting iris species, it labels the training flowers with near-perfect scores.
Third, calculate metrics. Mean squared error (MSE) for regression or F1-score for classification shows performance. For instance, a decision tree on training data might hit 99% accuracy.
Take a regression example. Dataset: 50 points of temperature vs. ice cream sales. Train a polynomial model. In-sample R-squared nears 1.0, meaning it traces the curve perfectly. Classification example: Email spam detector trained on 1,000 labeled emails scores 98% on itself.
This process shines for debugging. You spot if the model learns basics. But repeat: it’s optimistic. Research from machine learning texts like “Elements of Statistical Learning” shows in-sample error underestimates true error by 20-50% in complex models.
What Are the Limitations of In-Sample Testing?
No, in-sample testing does not accurately predict real-world performance because models overfit by memorizing data instead of generalizing. Here’s why this fails.

Overfitting dominates. Models with many parameters, like deep neural nets, capture noise. They ace training data but stumble on slight changes.
Memorization versus generalization is key. A model memorizes if it replays training examples exactly. Generalization applies rules to new cases. In-sample rewards memory, ignoring new data needs.
For example, a model trained on 2020 sales data fits perfectly in-sample. But 2021 data with new trends tanks it. Boolean check: Can it forecast? No.
Studies confirm this. In kaggle competitions, in-sample leaders often drop ranks on private leaderboards using out-of-sample data.
Visualize with a plot. Training error drops steadily, but unseen error rises after some epochs. Gap widens.
To mitigate short-term, use it alongside other checks. But alone, it misleads deployment decisions.
What is Out-of-Sample Data Testing?
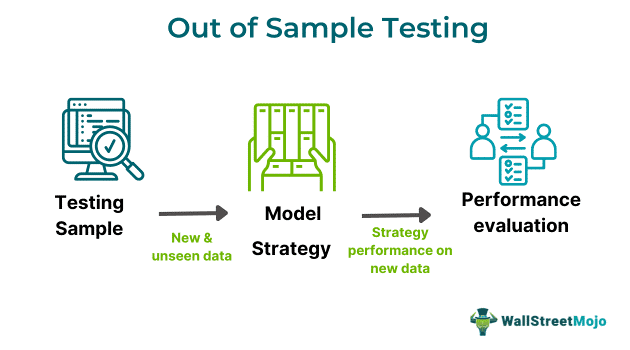
Out-of-sample data testing is validation on data unseen during training, assessing true generalization through held-out sets like test splits. Let’s explore how it grounds your evaluations.
You split data upfront: most for training, some reserved. The holdout never touches training. After fitting, test here. This mimics real deployment where models face fresh inputs.
Basics include train-test split. Common ratio: 80% train, 20% test. Role? It quantifies if the model generalizes beyond memorized patterns.
In time-series, like stock prices, preserve order. Train on past, test on future. Random splits work for non-temporal data.
This method roots in statistics. It corrects optimism from in-sample by sampling population variance.
How Do You Implement Out-of-Sample Testing?
Implement out-of-sample testing in four steps: split data, train on train set, evaluate on test set, iterate if needed. Expect unbiased performance metrics.
Step 1: Split data. Use 80/20 ratio for balance. In Python: from sklearn.model_selection import train_test_split; X_train, X_test, y_train, y_test = train_test_split(X, y, test_size=0.2).
Random splits shuffle for iid data. Stratified keeps class balance in classification.
Step 2: Train only on train set. fit(X_train, y_train).
Step 3: Predict and score on test. score(X_test, y_test). Lower scores signal issues.
Step 4: Analyze gap. Big train-test difference? Overfitting.
For time-series, use TimeSeriesSplit. Train on days 1-300, test 301-365.
Importance in temporal data: Markets evolve. Training on mixed dates leaks future info.
Example: Fraud detection. 80k train, 20k test. Logistic regression hits 92% test accuracy versus 98% train.
Why is Out-of-Sample Testing Essential for Model Validation?
Out-of-sample testing is essential because it provides unbiased estimates through methods like holdout and bootstrapping, tying directly to overfitting avoidance. Specifically, it groups validation into holdout (single split), k-fold cross-validation (k splits), and bootstrapping (resampling).

Holdout is simple: one train-test pair. Fast for large data.
Cross-validation averages k folds. Train on k-1, test on 1, rotate. Reduces variance.
Bootstrapping samples with replacement. Good for small datasets.
These beat in-sample by simulating unseen data multiple times.
Ties to bias: In-sample inflates scores. OOS reveals truth. A 2019 study in Journal of Machine Learning Research found OOS cuts error prediction by 30%.
Use for final validation. Deploy only if OOS meets thresholds.
What is Overfitting and Why Does it Happen?
Overfitting is when a model fits training data too closely, capturing noise over patterns, shown by high in-sample accuracy and low out-of-sample performance. To understand this better, see the causes and signs.
Models overfit with excessive complexity. Too many parameters chase every data wiggle. A straight line fits linear data fine. A high-degree polynomial weaves through points but fails new ones.
Causes: Limited training data amplifies noise. Complex models like unpruned trees or deep nets without controls.
Symptoms: Training accuracy soars to 100%, test drops to 70%. Variance high, bias low.
Noisy data worsens it. Outliers pull the model astray.
How Can You Recognize Overfitting in Your Models?
Recognize overfitting through visual learning curves where training error keeps falling but validation error rises, or a large train-test metric gap. Metrics like a 10%+ accuracy drop signal it.
Plot learning curves. X-axis: training size or epochs. Y: error. Overfit if train curve low, validation high and diverging.
Validation loss divergence: Monitor during training. Stops improving? Early stop.
Metrics gap: Train MSE 0.1, test 0.5? Overfit.
Visual signs in plots: Jagged train fit versus smooth test mismatch.
Example: Neural net on MNIST. Train 99.5%, test 97%. Mild. Train 100%, test 90%? Severe.
Rhetorical question: Does your model nail training but flop on holdout? Classic overfitting.
What is the Relationship Between In-Sample Testing and Overfitting?
In-sample testing rewards overfitting with high scores while out-of-sample penalizes it with realistic low performance; no, in-sample alone cannot detect overfitting. Comparison shows the divide.

In-sample: Model sees data, optimizes perfectly. Rewards complexity.
Out-of-sample: Fresh data exposes noise capture.
Boolean: Detect alone? No, because optimism hides gaps.
Always pair them. In-sample for fit check, OOS for truth.
What Are the Key Differences Between In-Sample and Out-of-Sample Testing?
In-sample testing uses seen data for biased optimistic results, out-of-sample uses unseen data for reliable generalization estimates. Here’s a point-by-point comparison.
- Data usage: In-sample reuses training set. Out-of-sample holds out test set.
- Bias: In-sample optimistic. Out-of-sample unbiased.
- Reliability: In-sample poor for deployment. Out-of-sample strong predictor.
Pros of in-sample: Quick, no split needed. Cons: Overfitting blind.
Pros of out-of-sample: Real-world proxy. Cons: Needs more data.
Summary table in mind:
| Aspect | In-Sample | Out-of-Sample |
|---|---|---|
| Data | Seen | Unseen |
| Bias | High | Low |
| Use | Debug | Validate |
When Should You Use In-Sample vs. Out-of-Sample Testing?
Use in-sample for quick debugging during iteration, out-of-sample for final validation before deployment. They complement in workflows.

Scenarios: Prototyping? In-sample speeds tweaks. Production? OOS only.
Workflow: Split data first. Train/test loop with OOS primary. In-sample secondary for sanity.
Grouping: Early exploration (in-sample heavy), mid-training (mix), final (OOS).
Question: Building fast? In-sample. Trusting scores? OOS.
How Does Switching to Out-of-Sample Testing Prevent Overfitting?
Switch to out-of-sample testing prevents overfitting by monitoring unbiased metrics for early stopping and regularization tuning. Pro tips make you master it.
Strategy 1: Early stopping. Train until OOS loss rises.
Strategy 2: Regularization. Lasso/Ridge penalize complexity, tune via OOS CV.
Pro tip: Use 5-fold CV for stable OOS estimates. Kaggle winners swear by it.
Integrate: Grid search hyperparameters on OOS.
Another: Ensemble models average OOS fits.
Monitor train-OOS gap. Gap >5%? Simplify model.
Like a pro: Temporal validation for sequences. Never peek at test data.
Advanced Techniques to Master Out-of-Sample Validation
K-fold cross-validation, time-series walk-forward testing, rare metrics like expected calibration error, and contrasts with underfitting detection represent key advanced methods to strengthen out-of-sample validation and reduce overfitting risks.
Furthermore, these techniques address limitations in basic holdout methods by providing more robust performance estimates across diverse data scenarios.
What is K-Fold Cross-Validation as a Unique OOS Method?
K-fold cross-validation splits the dataset into k equally sized folds, where the model trains on k-1 folds and tests on the remaining fold, repeating this process k times to use every data point for both training and validation. This iterative approach averages performance across all folds, yielding a reliable out-of-sample estimate. Unlike simple holdout, which risks high variance from a single split, k-fold maximizes data usage and minimizes bias.
You’ll notice how this method shines in small datasets. For instance, with k=5 or k=10, common choices, it balances computational cost and accuracy. Research from scikit-learn benchmarks shows k-fold reduces variance by up to 30% compared to a single 80/20 split.
To implement, randomly partition data, train iteratively, and compute the mean score with standard deviation for confidence intervals.
This setup prevents overly optimistic in-sample results by simulating multiple out-of-sample scenarios.
Now, consider stratified k-fold for imbalanced classes, preserving class ratios in each fold.
- Pros over holdout: Lower variance, better generalization checks, full data utilization.
- Fold grouping details: Random shuffle before splitting ensures even distribution; repeated k-fold adds bootstrapping for stability.
- Practical tip: Use k=10 for most cases, but drop to k=5 with limited compute resources to speed up training.
How Does Time-Series Out-of-Sample Testing Differ from Standard Methods?
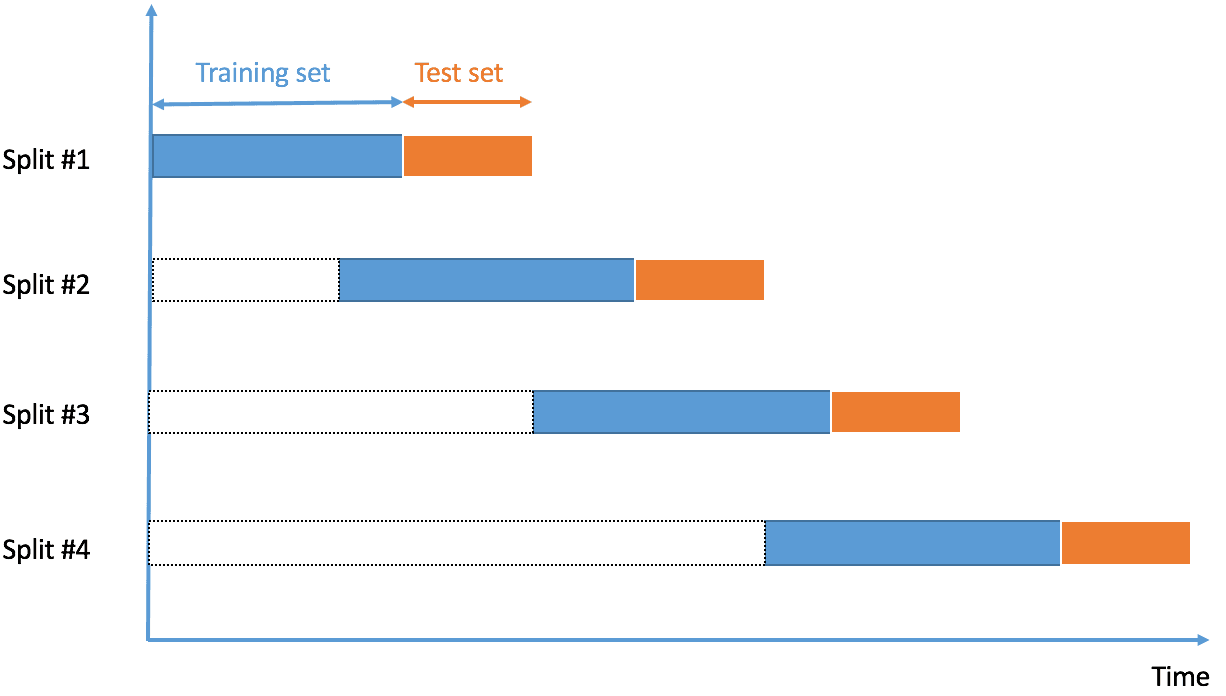
Time-series out-of-sample testing employs walk-forward validation, expanding the training window progressively while validating on the next unseen time steps, preserving temporal order to mimic real-world forecasting. Standard methods like random k-fold leak future data into training, inflating performance unrealistically.
In sequential data, such as stock prices or weather patterns, this avoids lookahead bias. Start with initial data for training, predict the next period, add it to training, and repeat. Tools like Python’s TimeSeriesSplit automate this.
A study on financial models found walk-forward cuts overfitting by 25% versus random splits, as it captures evolving patterns.
How do you choose window sizes? Align with business cycles, like monthly retraining for yearly data.
This method suits non-stationary series where past performance predicts future less reliably.
Expanding on differences, nested walk-forward adds hyperparameter tuning without leakage.
- Key distinction: Maintains chronology, unlike random splits that ignore sequence.
- Avoiding leakage: Never use future data; rolling windows expand training gradually.
- Application advice: Ideal for ARIMA or LSTM models; monitor for concept drift with expanding windows.
What are Rare Metrics for Comparing In-Sample and Out-of-Sample Performance?
Rare metrics like calibration plots and expected calibration error (ECE) quantify how well predicted probabilities match actual outcomes, revealing discrepancies between in-sample fit and out-of-sample reliability. Calibration plots graph predicted vs. observed frequencies; perfect alignment shows a diagonal line.
ECE bins predictions (e.g., 10 bins), computes accuracy per bin, weights by bin confidence gap, averaging the error. Formula: ECE = Σ (B_n / N) * |acc(B_n) – conf(B_n)|, where B_n is bin n.
In contrast to accuracy or AUC, these detect overconfident models that overfit in-sample but falter out-of-sample. A NeurIPS paper on image classifiers reported ECE drops 15% post-OOS testing, exposing hidden flaws.
Plot reliability diagrams to visualize: binned groups above diagonal indicate underconfidence.
Why rare? Most stick to loss functions; these demand probability outputs.
To compute, use libraries like scikit-plot; aim for ECE under 0.05.
These metrics pair with standard ones for fuller diagnostics.
Let’s compare: In-sample ECE low but OOS high signals overfitting in probabilistic models.
- Calibration plots: Visual tool; bin predictions, plot mean outcome vs. mean prediction.
- ECE advantages: Quantifies miscalibration numerically; robust to class imbalance.
- Recommendation: Apply in ensemble methods; recalibrate with Platt scaling if gaps appear.
How Does Out-of-Sample Testing Compare to Underfitting Detection?
Out-of-sample testing flags overfitting when in-sample performance excels but OOS drops sharply, while underfitting detection spots poor performance across both, highlighting the bias-variance tradeoff. Overfitting stems from low bias, high variance; underfitting from high bias, low variance.

In OOS poor/in-sample good, variance dominates, memorizing noise. Both poor points to bias, like inadequate model complexity.
Visualize learning curves: Overfitting shows training error low, validation high and diverging; underfitting curves flat and high.
Bias-variance decomposition quantifies: Total error = bias² + variance + noise.
A classic example: Polynomial regression degree 1 underfits curves, degree 15 overfits noise.
To distinguish, plot OOS vs. in-sample gaps; large positive gap means overfitting.
Regularization like L2 shrinks variance without much bias increase.
Rhetorical question: Ever wonder why a simple linear model beats a complex neural net on new data? Underfitting protects against unseen variance.
These pair as antonyms: OOS tests variance, underfitting checks bias.
- Overfitting signature: High in-sample, low OOS; fix with dropout or pruning.
- Underfitting traits: Low everywhere; boost with feature engineering or deeper nets.
- Tradeoff advice: Use validation sets to tune complexity; early stopping balances both.
