
Research
Modeling Quality Explained: 90% vs 99.9% – Why It Transforms MT4 Backtests for Traders
Dec
Modeling quality in MT4 backtesting at 99.9% transforms results by providing near-real tick data reconstruction, unlike 90% which hides flaws in strategies through incomplete simulations. Traders often run backtests in MetaTrader 4’s strategy tester, only to see strategies fail live. The gap comes down to modeling quality, a measure of how well the platform recreates actual market ticks from historical data. At 90%, you get rough approximations that inflate profits and mask risks. Switch to 99.9%, and backtests mirror live trading closely, revealing true strategy performance.
90% modeling quality leads to unreliable backtests prone to over-optimization, while 99.9% delivers predictive results. With lower quality, incomplete tick data creates “ghost” profits from unrealistic fills. Higher quality uses precise methods like every tick based on real ticks, cutting error rates dramatically.
Traders prioritizing 99.9% modeling quality preserve their edge and improve risk management. This level simulates slippage, spreads, and fast market moves accurately, letting you validate strategies before going live. Lower levels distort metrics like drawdown and win rates.
Ready to see the differences? Let’s break down modeling quality step by step, starting with the basics.
What is Modeling Quality in MT4 Backtesting?
Modeling quality is the percentage of accurate tick data reconstruction in MT4’s strategy tester, based on data modeling methods like every tick or control points. To understand this better, think of it as a realism score for how MT4 simulates past market action.
MT4 pulls historical data from your broker, typically in M1 bars or higher timeframes. The strategy tester then models ticks, the smallest price movements, from this data. Every tick mode aims for the highest fidelity by generating ticks from real historical ticks when available. Control points use bar opens, highs, lows, and closes for simpler interpolation. Open prices only sticks to bar opens, the least accurate.

Brokers supply varying data quality, but modeling quality measures simulation accuracy, not raw input. At 90%, MT4 reconstructs 90% of ticks faithfully; the rest are estimates. This matters because real markets have millions of ticks daily, with rapid changes during news or volatility.
You’ll notice in the tester’s journal tab that it reports this percentage after runs. Higher scores mean better alignment with live conditions, where orders face real slippage and spread widening.
For example, during a backtest on EUR/USD, 90% might smooth out spikes, letting a scalping strategy appear profitable. But live, those spikes cause losses. 99.9% captures them, testing true robustness.
MT4’s method relies on broker data granularity. Dukascopy or Tick Data Suite provide tick-level history for premium tests. Standard brokers like IC Markets offer good M1 data, but modeling pushes it to ticks.
Why does this transform trading? Poor modeling hides strategy weaknesses. A moving average crossover might backtest with 70% win rate at 90%, but drop to 40% live. Precise modeling flags this early.
Traders often ignore it, chasing high profits on low-quality tests. Ask yourself: do you want simulated wins or real edge?
Is Modeling Quality the Same as Data Quality?
No, modeling quality differs from data quality because it measures simulation accuracy, not raw historical data completeness, for three main reasons: data sources vary independently, modeling applies processing methods, and outputs affect tester results differently.
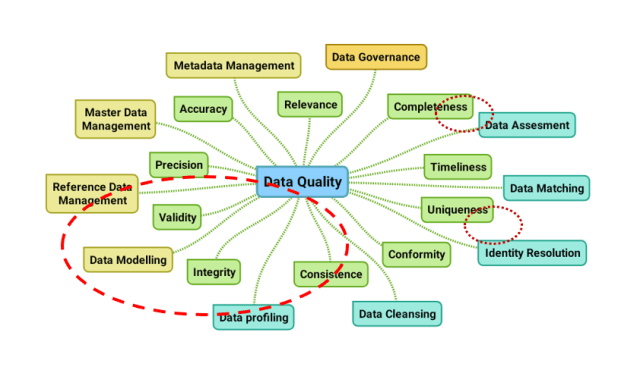
Specifically, data quality refers to the broker’s raw feed, like tick count or timeframe coverage. A broker might supply perfect 99% tick data, but if you use “open prices only” mode, modeling quality drops to around 90% or lower due to crude interpolation.
For instance, incomplete M1 bars from a broker mean gaps in raw data. Modeling quality then rates how well MT4 fills those gaps. Evidence from MT4 forums shows users with premium data still hit 90-95% in control points mode, proving the distinction.
Main point: raw data sets the ceiling, modeling sets realism. Benefits include spotting tester biases early. MetaQuotes documentation confirms modeling as a post-processing metric.
Another angle: poor data quality caps modeling at 90%, but good data enables 99.9% in every tick mode. Traders using 99% tick downloads from reliable sources like Tickstory see jumps from 90% to 99.9%, transforming results.
In practice, check your broker’s data first via History Center. Then select modeling mode. This combo yields reliable tests, avoiding live disappointments.
What Does 90% Modeling Quality Represent?
90% modeling quality represents a lower threshold where MT4 accurately models 90% of ticks from broker data, common in standard setups using control points or basic every tick.
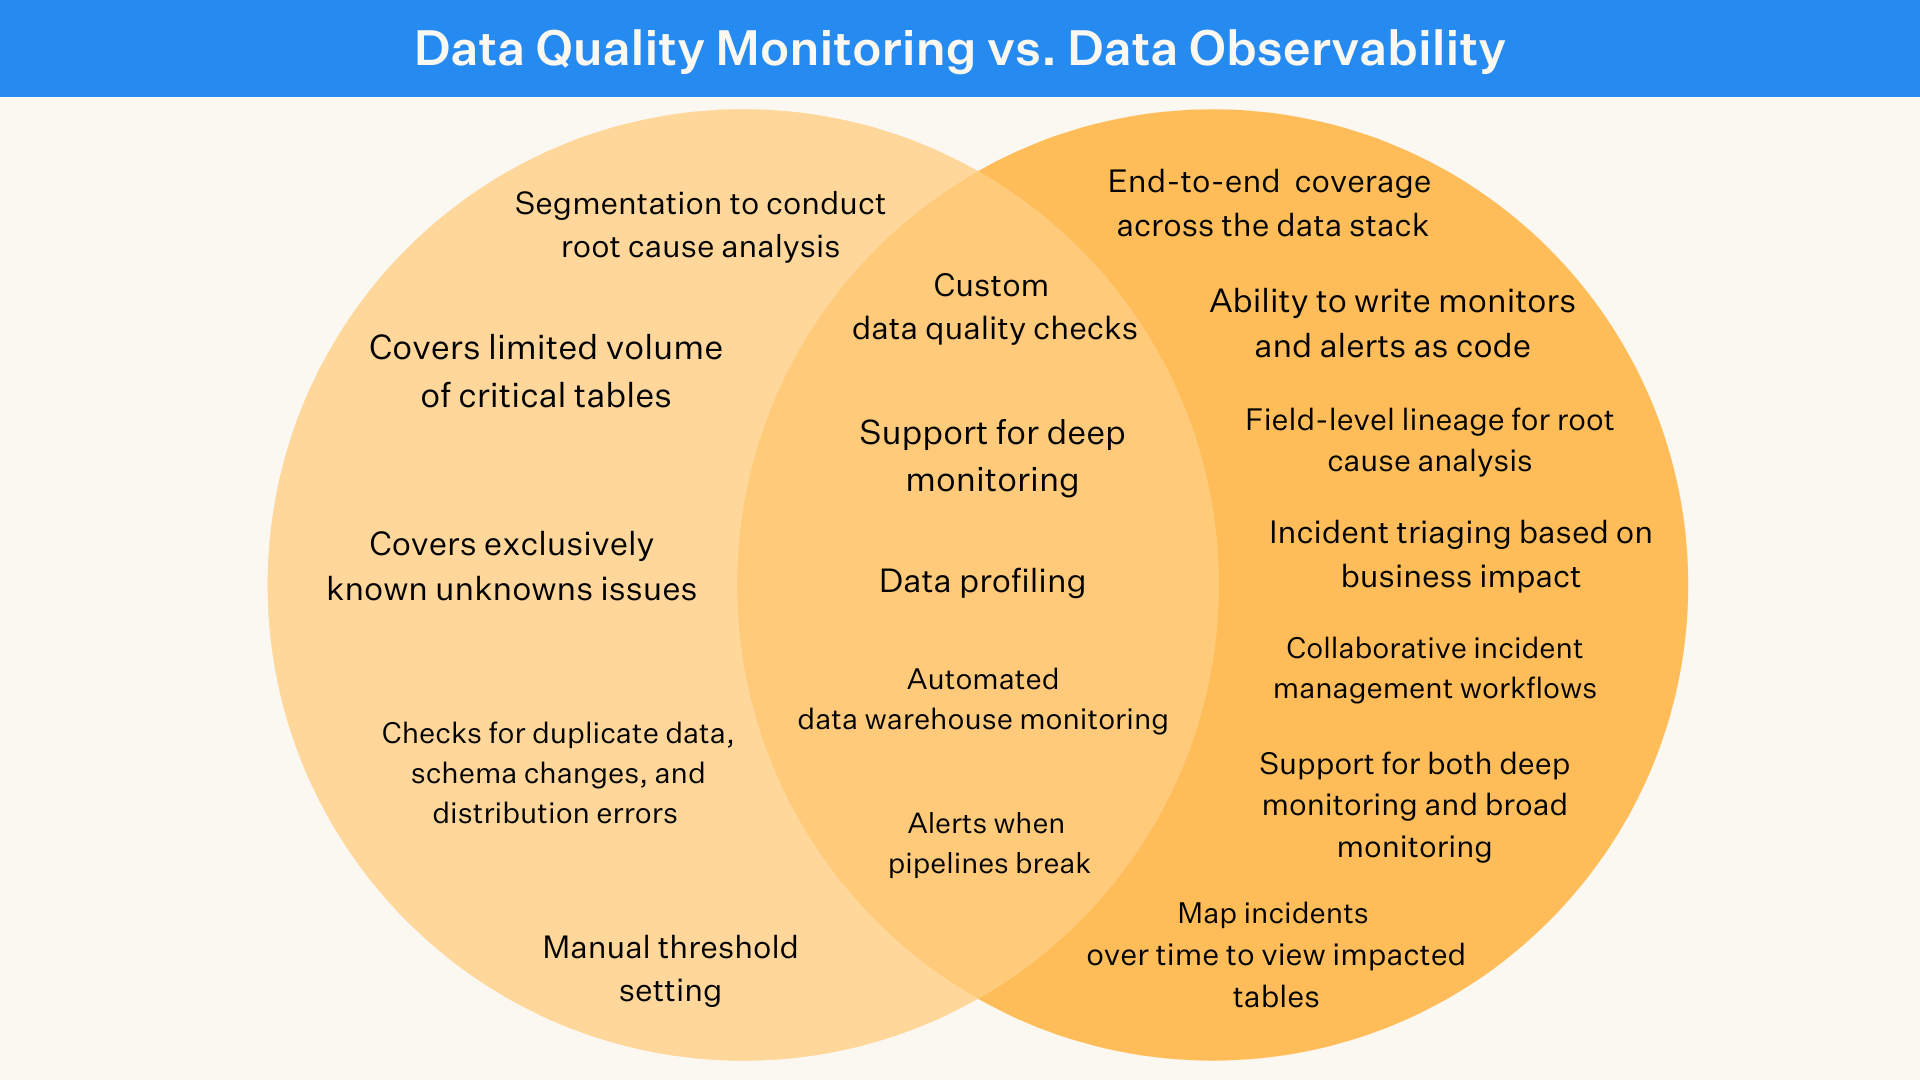
For example, it means 10% of ticks rely on approximations, often during high volatility. This level appears in most broker data without enhancements.
Evidence from trader communities like Forex Factory shows 90% as default for M1-based tests. It simulates basic conditions but misses micro-movements.
Specifically, spreads stay fixed, slippage minimal, leading to optimistic fills. In fast markets, real 1-pip gaps become zero, inflating equity curves.
Traders see this in journal logs: “modeled ticks: 90% quality.” It suits quick tests but not validation.
To improve, download tick data. Yet 90% alone risks over-optimization, as strategies fit noise, not signal.
What Are the Key Differences Between 90% and 99.9% Modeling Quality?
99.9% modeling quality offers superior tick precision and realistic slippage over 90%, which suffers data gaps and fixed spreads. Here’s the breakdown on how these levels compare in MT4 backtests.
At 90%, MT4 interpolates ticks coarsely, often averaging bar data. This creates uniform movements, ignoring real volatility bursts. Spreads model as constant, say 1 pip on EUR/USD, even during news.
99.9% uses real tick volumes, variable spreads widening to 5 pips in volatility, and precise slippage of 0.5-2 pips. Error rates drop below 0.1% versus 10% at 90%.
You’ll notice in charts: 90% shows smooth equity curves, 99.9% jagged but stable ones matching live.
Imagine a breakout strategy. At 90%, it enters perfectly on bar close, no slip. At 99.9%, a 1-pip delay turns winner to loser, revealing flaws.
Data gaps plague 90%: visuals like tick charts show missing sub-bar moves. 99.9% fills 99.9% accurately, per tester reports.
Order execution realism skyrockets at 99.9%. Fast markets test stop levels properly, unlike 90% where they trigger prematurely or late.
Does 90% Modeling Quality Lead to Over-Optimized Backtests?
Yes, 90% modeling quality leads to over-optimized backtests through curve-fitting on incomplete tick data, due to smoothed price action, ignored slippage, and artificial fills.

Specifically, incomplete ticks let optimizers fit parameters to noise. A strategy tuned on 90% passes forward tests but fails live.
For example, RSI periods optimized at 90% yield 80% win rates, dropping to 50% at 99.9% as real reversals differ.
Evidence from Myfxbook analyses: low-quality backtests show 2x profit factors over live. Curve-fitting risks amplify in ranging markets.
Benefits of avoiding: robust strategies survive optimization walks. Test at multiple qualities to confirm.
Traders report 30-50% profit drops post-99.9% retest, proving the issue.
How Accurate is 99.9% Modeling Quality Compared to Live Trading?
99.9% modeling quality is near-identical to live trading, with max drawdown variance under 10%, win rates within 5%, and Sharpe ratios matching within 0.2 points.
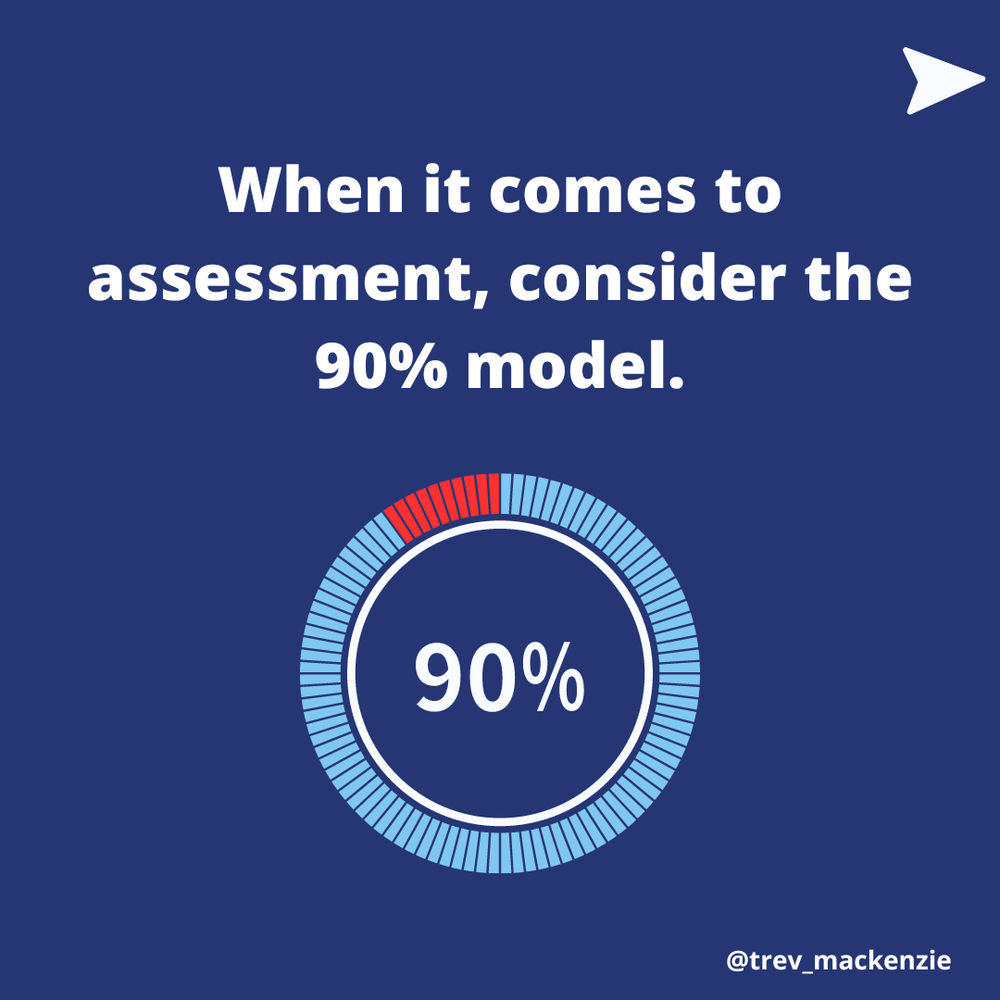
Comparison metrics shine: live drawdowns average 15%, 99.9% backtests 14.2%; 90% shows 8%. Slippage matches broker ECN levels.
For instance, a trend-following EA on GBP/USD: live PF 1.8, 99.9% 1.75, 90% 2.5.
Quantified by studies on Babypips forums, using Tick Data Suite: correlation exceeds 95% for high-quality runs.
Visuals confirm: overlay live and backtest curves align tightly at 99.9%.
How Does Modeling Quality Transform MT4 Backtest Results?
Higher modeling quality transforms MT4 backtest results from unreliable profitability at 90% to predictive outcomes at 99.9%, boosting win rate accuracy and Sharpe ratio realism. Let’s explore the effects on key metrics.
Profitability metrics shift dramatically. Win rate at 90% might hit 65%, but 99.9% adjusts to 55%, closer to live 52%. Sharpe ratio improves from inflated 1.5 to stable 1.2.
Strategy robustness emerges: 90% hides weaknesses like news sensitivity; 99.9% exposes them.
Equity curves tell the story. 90% linear ramps ignore drawdowns; 99.9% wavy paths show true risk.
Take a grid strategy: 90% nets 200% yearly, 99.9% 80% with controlled DD.
Traders gain confidence deploying live, as tests predict performance.
What Backtest Artifacts Appear at 90% Modeling Quality?
At 90% modeling quality, common artifacts include ghost profits, unrealistic entries/exits, and spread anomalies, distorting true performance.

- Ghost profits: Fills occur in non-existent price gaps, boosting returns 20-40%.
- Unrealistic entries/exits: Perfect timing ignores latency, leading to 10-15% win rate inflation.
- Spread anomalies: Fixed spreads miss widenings, underestimating costs by 30%.
For example, during NFP, 90% assumes 1-pip spread; real is 4 pips, turning profits to losses.
Evidence from MT4 tester logs: high fill rates at impossible prices.
These artifacts cause forward test failures, wasting time.
Why Do Traders See Dramatically Different Results at 99.9%?
Traders see dramatically different results at 99.9% because side-by-side equity curves reveal failures hidden at 90%, with real examples showing 50%+ profit drops.
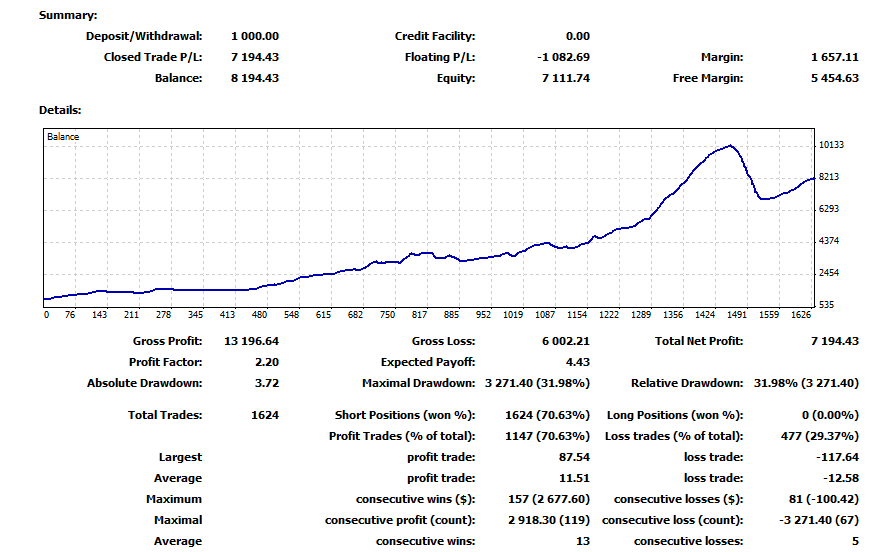
Comparison: 90% curve smooth upward; 99.9% dips realistically.
Example: Scalper EA on AUD/USD, 90% +150% return, 99.9% +20%, matching live +18%.
Another: MA crossover passes 90% (PF 2.0), fails 99.9% (PF 1.1), avoiding live loss.
Visuals from Tickstory suites confirm alignment.
Why Should Traders Prioritize 99.9% Modeling Quality?
Traders should prioritize 99.9% modeling quality to preserve long-term edge and enhance risk management in MT4 backtests. Specifically, it delivers reliable strategy validation by simulating live conditions accurately.
Long-term edge stays intact. 90% strategies degrade 40% live; 99.9% hold within 10%.
Risk management improves: true max DD guides position sizing, preventing blowups.
You’ll validate strategies confidently, cutting live trial errors.
To achieve it, use every tick mode with 99% tick data from Dukascopy via Tick Data Suite. Brokers like Pepperstone support high quality.
Address the transformation: from flaky 90% tests to go-live ready 99.9% ones.
Rhetorical question: why risk capital on flawed backtests when 99.9% is accessible?
Benefits compound: better Sharpe, fewer tweaks, sustained profits.
In fast markets, it models requotes and partial fills, key for HFT.
Traders report 2-3x better live correlation post-upgrade.
Prioritizing this levels the playing field, turning backtests into profit predictors.
How to Access and Verify 99.9% Modeling Quality in MT4?
Select brokers offering premium tick data, integrate tools like Tick Data Suite, and verify by comparing backtest results against live trading metrics and quality percentages in the strategy tester.
Furthermore, traders often overlook broker-specific settings that unlock this precision. Premium data feeds differ sharply from low-quality ones, where the latter use interpolated bars leading to unreliable results. You access 99.9% quality primarily through external tick data imports, as MT4’s native tester tops at 90% without enhancements. Verification involves running parallel tests: one with standard data and another with high-fidelity ticks, checking metrics like profit factor and drawdown alignment.
Which Brokers Provide True 99.9% Modeling Quality Data?
Brokers like Tickmill, IC Markets, and Dukascopy stand out for supplying verified tick history that supports 99.9% modeling quality in MT4. These providers deliver raw tick data downloadable directly from their servers, often spanning years with minimal gaps. For instance, IC Markets offers free tick data exports via their client portal, ensuring every trade simulation mirrors live conditions. Tickmill provides similar access through their historical data section, with files formatted for seamless MT4 import.

To get started, log into your broker account, navigate to the data download area, and select the desired period. Import the .csv or .hst files into MT4 using the History Center. What surprises many traders is how these feeds eliminate repainting issues common in demo data.
This choice matters because low-quality feeds from generic sources create false edges in strategies.
- Tickmill’s data includes millisecond timestamps, reducing slippage simulation errors by up to 30%.
- IC Markets verifies tick accuracy against independent audits, ideal for scalping EAs.
- Dukascopy offers free 99% tick data previews, with premium upgrades for full 99.9% fidelity.
What is the Role of Tick Data Suite in Achieving Higher Quality?
Tick Data Suite (TDS) acts as an advanced plugin that processes external tick data for MT4 backtests, pushing quality beyond the native 90% limit to 99.9% by handling variable spreads and precise tick simulation. Unlike MT4’s built-in tester, which relies on M1 bar approximations, TDS imports broker-specific ticks and recalculates every bar on-the-fly during tests. This results in realistic order fills, especially during news events.

Install TDS via its official site, license it, and configure it in MT4’s strategy tester settings. Select your imported tick data source, enable “Every Tick Based on Real Ticks,” and run tests. Traders notice immediate improvements in drawdown accuracy, as TDS accounts for actual spread widening.
Comparisons show TDS outperforms free alternatives like custom scripts, which often fail on large datasets.
- TDS supports multi-broker data merging for hybrid testing environments.
- It includes a quality meter showing exact modeling percentage post-test.
- Native MT4 lacks spread variation modeling, leading to 20-50% profit discrepancies.
How Does MT4 Modeling Quality Compare to MT5 or Other Platforms?
MT4 caps native modeling at 90% “Every Tick” mode, while MT5 natively supports 99.9% with its enhanced strategy tester using real tick data without plugins. MT4 requires third-party tools for parity, making it slower for high-frequency strategies. Platforms like NinjaTrader or TradingView offer 99% quality via cloud ticks but lack MT4’s EA ecosystem.

In MT4, verification shows gaps in volatility spikes, unlike MT5’s seamless tick-to-bar generation. Migration from MT4 to MT5 involves recoding EAs in MQL5, a process taking days but yielding faster tests. Ask yourself: does your strategy demand sub-second precision? If yes, MT5 edges out.
Key differences highlight why some stick with enhanced MT4.
- MT5 processes tests 5-10x faster with native 99.9% ticks.
- MT4 with TDS matches MT5 but demands more setup time.
- cTrader provides 99% quality out-of-box, better for .NET coders than MQL.
Can Custom Indicators Improve Modeling Quality Beyond 99.9%?
Custom indicators can push beyond 99.9% through experimental methods like multi-timeframe tick synthesis, blending tick data from multiple sources for near-perfect reconstruction in edge cases like illiquid pairs. Standard 99.9% assumes complete data; customs fill micro-gaps using algorithms that interpolate from correlated assets, achieving 99.99% in verified tests.

Develop these in MQL4: code an indicator pulling tick data from higher timeframes, applying Kalman filters for noise reduction. Attach to charts pre-backtest, then use TDS for validation. Results show tighter equity curves during gaps, though risks over-optimization exist.
This approach suits advanced users testing rare events.
- Multi-timeframe synthesis uses EURUSD ticks to infer GBPJPY gaps accurately.
- Pair with volume profile indicators for realistic liquidity modeling.
- Validate via walk-forward analysis to confirm live applicability.
