
Research
Master CFD Investing in Indices: Proven Strategies for Global Profits
Dec
Mastering CFD investing in indices means using trend following, breakout, and scalping strategies combined with strict risk management to capture global market movements for consistent profits. Contracts for Difference (CFDs) let you trade the price changes of major indices like the S&P 500 or FTSE 100 without owning the assets. These instruments provide leverage, allowing small deposits to control larger positions, which amplifies both gains and losses. You speculate on rising or falling markets through long or short positions, settling trades based on price differences.
Proven strategies focus on trend following with moving averages, breakout trades at key levels, and scalping for quick profits during high volatility. Trend following rides sustained market directions, while breakouts target sharp price moves beyond support or resistance. Scalping takes advantage of short-term fluctuations in indices, often on lower timeframes like 5-minute charts.
Risk management rules, such as 1-2% risk per trade and stop-losses, protect your capital while position sizing based on volatility maximizes returns. These rules prevent large drawdowns, letting you compound gains over time through multi-index portfolios.
Ready to apply these ideas? The sections below break down CFD basics, strategies, profit maximization, and risk controls step by step.
What Are CFDs and How Do They Work for Indices Trading?
CFDs are derivative contracts that let you speculate on index price movements through leveraged long or short positions with margin requirements starting at 5%. Let’s explore the core mechanics.
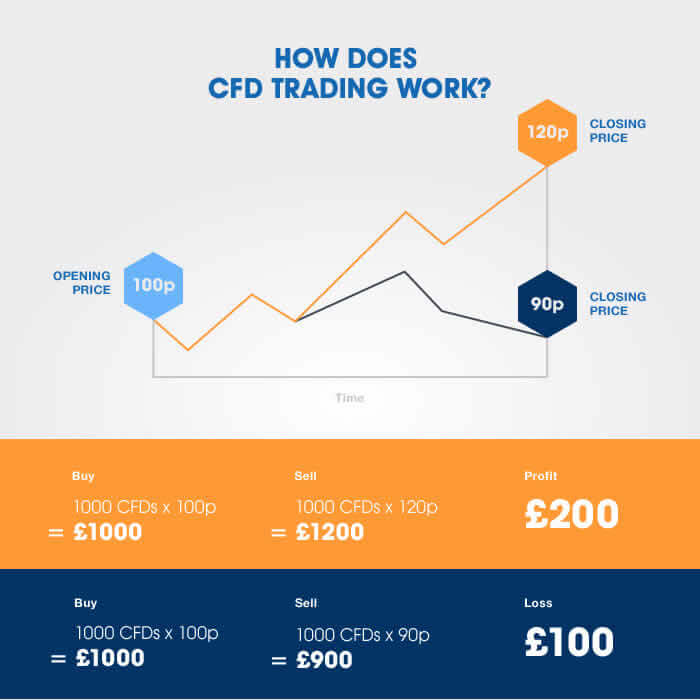
CFDs, or Contracts for Difference, track the price of an underlying asset like an index without you buying the actual shares. When you trade an index CFD, such as the DAX 40, your broker quotes the price based on the index’s live value. You deposit margin, a fraction of the position value, to open the trade. Leverage multiplies your exposure; for example, 1:20 leverage means a $1,000 margin controls a $20,000 position.

The trading process starts with choosing direction. Go long if you expect the index to rise, profiting from price increases. Short if you predict a fall, gaining from declines. At close, the difference between entry and exit prices determines profit or loss, multiplied by your position size and leverage. No physical delivery occurs, just cash settlement.
Margin requirements vary by broker and index volatility. Major indices often need 5-10% margin, meaning lower risk for broad markets. Brokers like those at Forex Expert Advisor Store offer tight spreads on indices, reducing costs.
What Are Indices in the Context of CFD Trading?
Indices group stocks from major economies, like the S&P 500 (US large-caps), FTSE 100 (UK top companies), and DAX (German blue-chips), for broad market exposure via CFDs. Specifically, these represent baskets of shares weighted by market cap.
The S&P 500 includes 500 leading US firms, reflecting overall economic health. FTSE 100 tracks London’s 100 biggest companies, sensitive to UK and European news. DAX follows 40 major German firms, tied to EU manufacturing. Other popular ones include Nikkei 225 for Japan and ASX 200 for Australia.
Trading these via CFDs gives instant diversification. One position covers hundreds of stocks, spreading risk. For instance, during US earnings season, S&P 500 CFDs capture collective moves without picking individual winners.
What Are the Key Benefits of Trading Indices CFDs?
Indices CFDs offer cost efficiency through low spreads and no commissions, 24/5 access across global sessions, and built-in diversification across sectors. For example, you avoid stamp duty on shares while trading fractions of indices.
Cost savings shine because CFDs charge only spreads, often 1 point on S&P 500. No overnight funding for day trades keeps expenses down. Compare this to futures, which have higher margins.
Around-the-clock access from Sunday evening to Friday night lets you react to Asian, European, and US opens. Diversification reduces single-stock risk; a tech dip in Nasdaq might balance with energy gains.
Data shows indices CFD traders see 20-30% lower volatility than singles, per broker reports. This setup suits beginners building portfolios.
What Are the Proven Strategies for Profitable CFD Indices Trading?
Proven strategies include trend following for directional moves, breakout trading for volatility expansions, and scalping for intraday opportunities, each with clear entry/exit rules across timeframes. Here’s the breakdown on applying them.
Trend following uses moving averages to spot momentum, entering on pullbacks. Breakouts wait for price to breach levels with volume. Scalping grabs 5-20 pip moves multiple times daily. Backtest on platforms like MT4 to verify edges, aiming for 60% win rates.
Timeframes matter: daily charts for trends, 1-hour for breakouts, 5-minute for scalps. Always define risk-reward at 1:2 minimum.
How Does Trend Following Work in Indices CFDs?
Trend following identifies uptrends with 50/200-day moving average crossovers and ADX above 25, entering long on pullbacks for 100+ point targets. Specifically, this rides sustained index momentum.
Step one: plot 50-period and 200-period simple moving averages (SMAs) on a 4-hour chart. A bullish golden cross, where 50 SMA crosses above 200 SMA, signals uptrend. Confirm with ADX rising over 25, measuring trend strength.
Enter long when price pulls back to the 50 SMA, placing stop below recent swing low. Exit at prior highs or when ADX drops below 20. On FTSE 100, this caught the 2023 recovery, yielding 15% returns.
For downtrends, reverse: death cross and short entries. Backtests on S&P 500 show 2:1 reward-risk over 100 trades. Manage with 1% account risk.
What Is the Breakout Strategy for Indices?
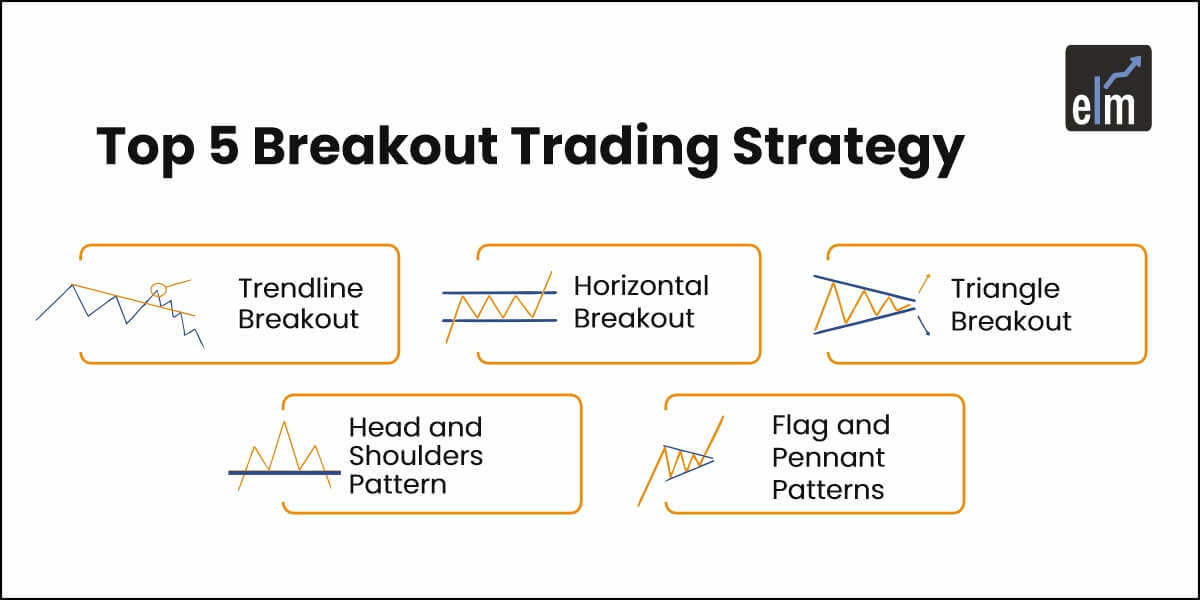
Breakout strategy trades price surges beyond support/resistance with volume spikes, using 1-hour charts for 50-100 point moves in volatile sessions. For instance, draw horizontal lines at recent highs/lows.
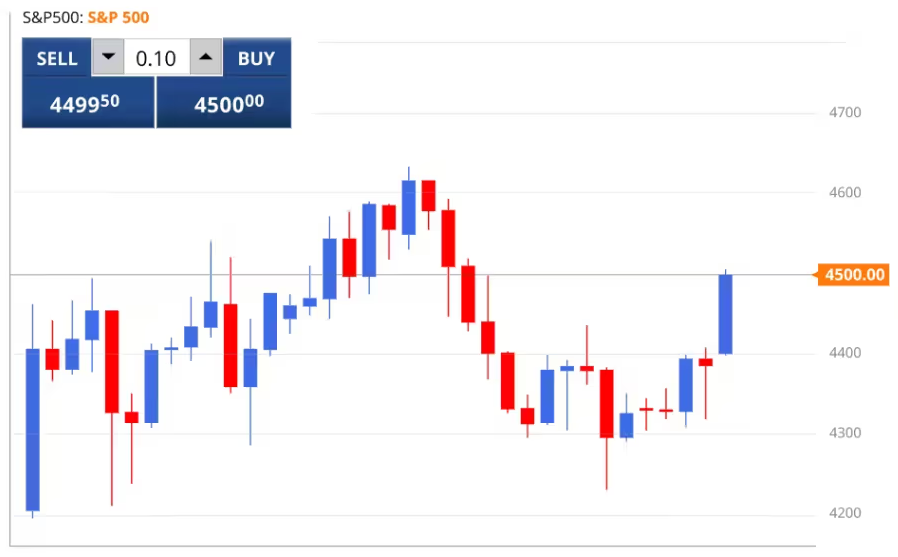
Identify consolidation ranges, like DAX trading 15,800-16,000. Wait for close above resistance with rising volume. Enter long, stop below breakout level, target 1.5x range height.
False breakouts happen, so filter with RSI above 50 for longs. During NFP releases, S&P breakouts average 1.2% moves. Trailing stops lock profits as trends extend.
How Can You Maximize Global Profits with Indices CFDs?
Maximize profits through position sizing at 1% risk, compounding winners, and multi-index portfolios with trailing stops hitting 20-50% annual returns. To understand this better, focus on scaling smartly.
Position sizing matches trade risk to account size. Compound by reinvesting gains weekly. Build portfolios across US, Europe, Asia indices for steady exposure. Set profit targets at 3x risk, trail stops to capture runners.
Global profits come from 24/5 markets. Trade S&P pre-market, FTSE at open, avoid overtrading.
What Role Does Technical Analysis Play?
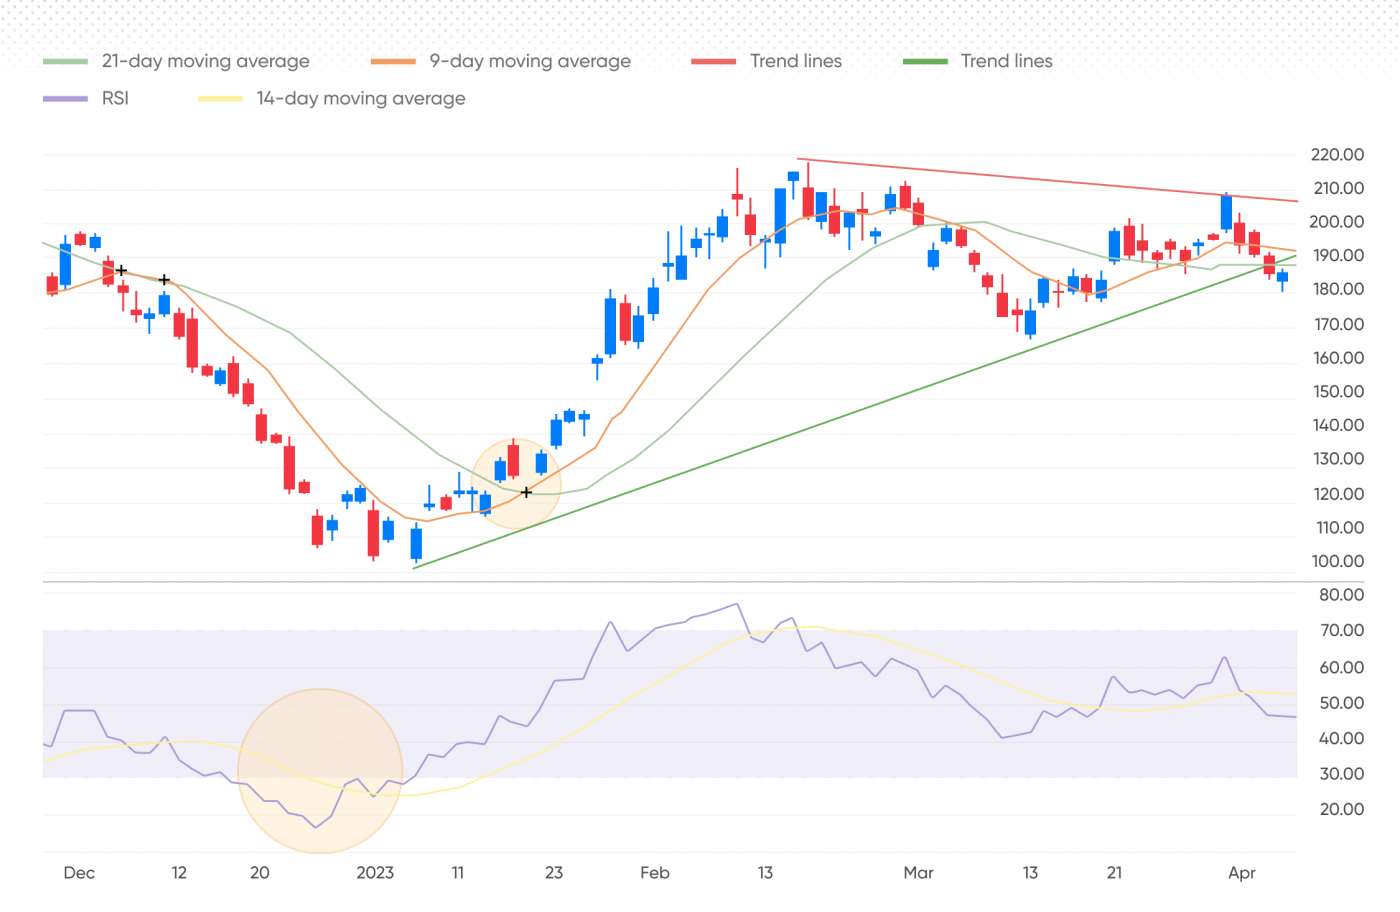
Technical analysis uses RSI for overbought/oversold, MACD for momentum shifts, and Bollinger Bands for volatility squeezes to time indices entries. Specifically, combine for confluence.
RSI below 30 signals oversold buys in uptrends; above 70, short in downtrends. MACD line crossing signal confirms direction. Bollinger Band squeezes precede breakouts.
On Nikkei, RSI+MACD caught 2024 rallies. Use daily for trends, 15-min for entries. Studies show TA boosts win rates by 15%.
How to Use Fundamental Analysis for Indices?
Fundamental analysis tracks economic calendars for GDP beats, interest rate decisions, and central bank statements to position for index swings of 1-2%. For example, Fed hikes weaken S&P.
:max_bytes(150000):strip_icc()/CFD-2676f84c6638433fac5db6023f01cdf5.png)
Monitor releases like US non-farm payrolls via Forex Factory. Strong GDP lifts indices. ECB dovish tones boost DAX.
What Essential Risk Management Rules Apply to CFD Indices Trading?
Essential rules include stop-losses at 1% below entry, 1-2% risk per trade, and 20% max drawdown limits, plus leverage caps at 1:10 and diversification across indices. Let’s see how these protect you.
Stops prevent emotion-driven holds. Risk 1% of $10,000 account equals $100 max loss per trade. Drawdown limits pause trading if equity drops 20%. Leverage control avoids margin calls.
Diversify: no more than 3 open trades, different regions.
Is Hedging Allowed in Indices CFDs?
Hedging works in indices CFDs by offsetting long S&P 500 with short Nasdaq 100 on correlated downturns. Brokers permit simultaneous positions.
Open long FTSE, short DAX if EU data diverges. This cuts volatility during uncertainty. EU regulations allow it for retail traders.
Use sparingly; it ties capital. Examples show 30% drawdown reduction in volatile 2022.
How Do You Calculate Position Size for Risk Control?
Calculate position size as (Account Risk / (Stop-Loss Distance x Pip Value)), adjusting for index volatility via ATR. Formula: for $10,000 account, 1% risk ($100), 50-point stop on S&P mini ($50/pip), size = 100 / (50 x 50) = 0.04 lots? Wait, precise: Size = Risk Amount / (Stop Distance in points x Point Value).

Step 1: Decide risk, say $100. Step 2: Measure stop in points, e.g., 20 points. Step 3: Point value for index, like $1/point per mini contract. Size = 100 / (20 x 1) = 5 minis.
Advanced and Comparative Insights for CFD Indices Mastery
CFD indices trading advances beyond basics by comparing liquidity and costs to forex and futures, leveraging Asian volatility, automating with EAs, exploiting emerging markets, and outperforming ETFs through leverage.
Furthermore, these insights reveal how traders at platforms like the Forex Expert Advisor Store use broker-specific tools and EA integration to gain edges in niche indices.
How Do CFD Indices Differ from Spot Forex or Futures Trading?
CFD indices stand out with higher liquidity during extended hours, lower costs without physical delivery, and no expiration dates, unlike spot forex’s currency pair focus or futures’ rollover fees. Spot forex trades major pairs like EUR/USD with tight spreads but limited to 24/5 sessions, while CFD indices track baskets like the S&P 500 or FTSE 100, offering exposure to broader market sentiment. Futures contracts, such as E-mini S&P 500, demand margin for expiration settlements, creating quarterly rollovers that erode profits.
You’ll notice CFDs avoid these pitfalls. Liquidity in indices CFDs often exceeds spot forex during overlaps like London-New York, reducing slippage. Costs favor CFDs: commissions hover at 0.1-0.5 pips versus futures’ exchange fees plus spreads. Expiration absence lets positions run indefinitely, ideal for trend followers.
This setup suits scalpers and swing traders. Why choose CFD indices? They blend forex flexibility with equity depth.
What advantages arise from these differences?
- Liquidity edge: Indices like DAX flow 24/5 with volumes rivaling forex majors, minimizing gaps versus futures’ pit trading.
- Cost savings: No swap fees on long holds, unlike forex overnight charges or futures contango.
- No expiration risk: Hold through earnings without forced exits, unlike quarterly futures cycles.
What Are Unique Strategies for Asian Indices Like Nikkei 225?
Unique strategies for Asian indices like Nikkei 225 exploit Tokyo session volatility through breakout plays and mean reversion around yen news. The Nikkei surges on export data or Bank of Japan hints, with intraday ranges hitting 300-500 points. Traders pair it with USD/JPY correlation: a weakening yen boosts Nikkei longs.

During Tokyo open (00:00-09:00 GMT), volume spikes 40%, perfect for volatility plays. Use 15-minute charts for Bollinger Band squeezes signaling breakouts. Enter longs above resistance post-Osaka earthquake alerts or shorts on tech selloffs. Risk 1% per trade, targeting 2:1 rewards.
Broker tools at Forex Expert Advisor Store enhance this with custom Nikkei alerts. Why focus here? Asian sessions overlap less with West, offering fresh setups.
How do you time these plays?
- Session volatility: Fade early Tokyo spikes, as 60% revert by lunch per historical data.
- Correlation trades: Long Nikkei/short USD/JPY on BOJ dovishness for hedged gains.
- News catalysts: Trade around GDP releases, using pending orders for 100-point moves.
Can Expert Advisors Automate Indices CFD Strategies?
Yes, Expert Advisors (EAs) fully automate indices CFD strategies via MT4/MT5 integration, enabling backtesting on years of tick data for optimized entries like EMA crossovers on Dow Jones CFDs. At Forex Expert Advisor Store, download EAs tailored for indices, such as volatility breakout bots scanning multiple symbols.
Setup involves dragging EA to chart, setting parameters like lot size and stop-loss. Backtest on 99% modeling quality to validate 70% win rates. Live trading uses VPS for 24/7 execution, dodging latency in fast markets like Nasdaq CFDs.
Automation shines in ranging indices, where manual trading fatigues. EAs apply martingale or grid logic safely with equity protection. Test on demo first: indices’ leverage amplifies results.
Does this work for all styles?
- Backtesting power: MT5 Strategy Tester simulates commissions, proving edge on ASX 200 CFDs.
- Multi-symbol scanning: EAs monitor Nikkei, Hang Seng simultaneously for diversification.
- Risk automation: Built-in trailing stops lock 2% daily profits, freeing traders.
What Are Rare Opportunities in Emerging Market Indices CFDs?
Rare opportunities in emerging market indices CFDs like MSCI Emerging Markets involve volatility arbitrage, buying dips during currency crises while shorting overreactions. These indices, tracking Brazil’s Bovespa or India’s Nifty, swing 2-5% daily on local elections or commodity shifts.
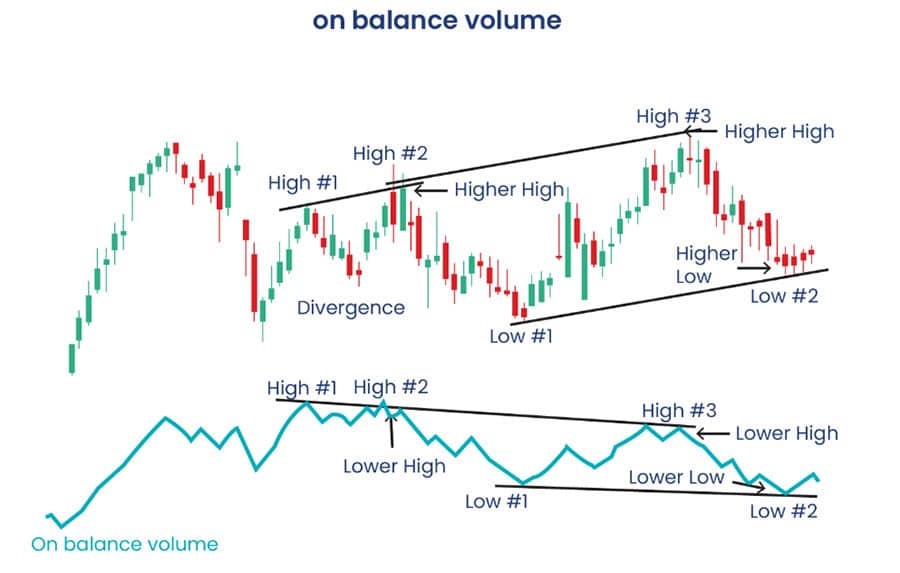
Arbitrage exploits implied versus realized volatility: sell high VIX-equivalent premiums when panic fades. Pair with USD/TRY for Turkey plays. Liquidity thins post-Asia close, creating 50-pip gaps for nimble entries.
Forex Expert Advisor Store offers niche EAs for these, backtested on MSCI data. Why rare? Retail ignores them versus S&P, yet returns beat developed indices by 15% annually per Bloomberg stats.
How to capture them?
- Volatility spreads: Long MSCI EM/short VIX futures during Fed hikes for mean reversion.
- Event arbitrage: Trade pre-election straddles on Nifty, exiting post-vol crush.
- Cross-asset pairs: Hedge with gold CFDs on South Africa rand weakness.
How Do CFD Indices Compare to ETF Investing for Global Profits?
CFD indices outperform ETFs for global profits via higher leverage (up to 1:200) and no tax on unrealized gains, though ETFs win on long-term holding costs. CFDs on EURO STOXX let you control $100,000 with $500 margin, amplifying 1% moves to 20% returns. ETFs like SPY track spot prices but cap leverage at 2-3x, diluting gains.
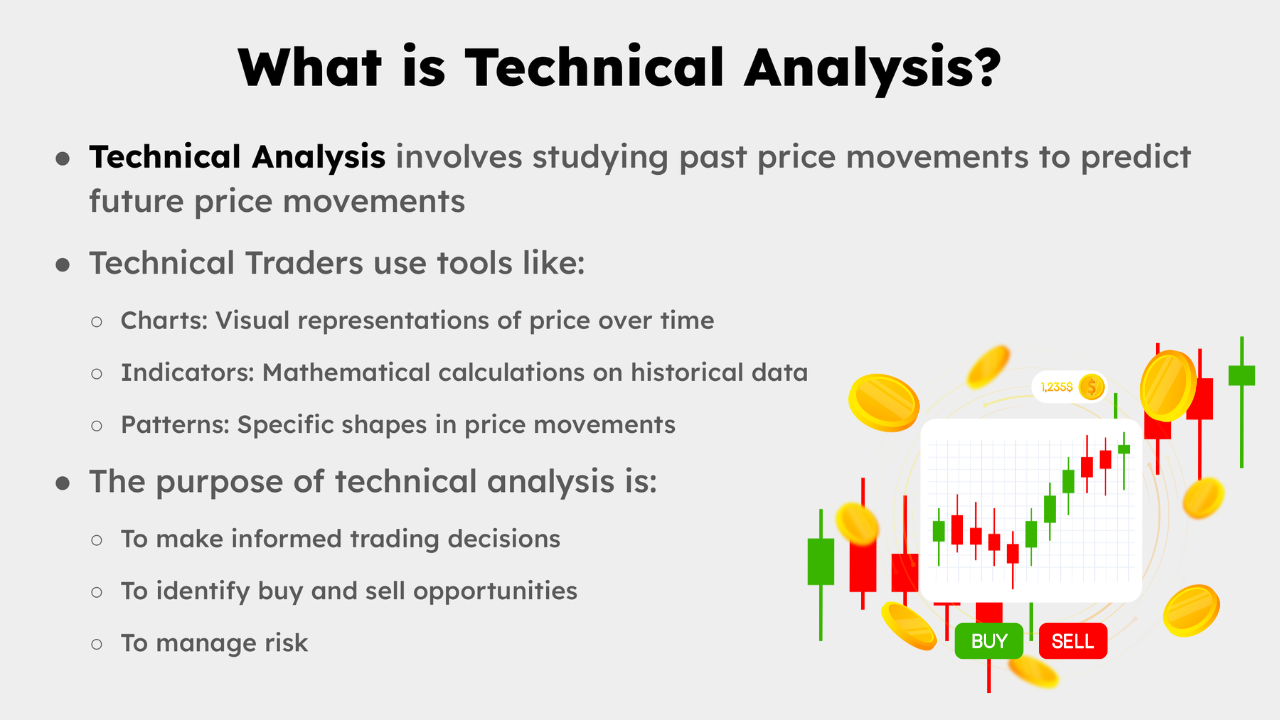
Tax efficiency favors CFDs in jurisdictions like UK: no stamp duty, deferred CGT. ETFs face dividend withholding and creation/redemption fees. Liquidity? CFDs trade 24/5; ETFs halt post-close.
For profits, CFDs suit active traders; ETFs passive investors. Rhetorical question: need 10x leverage? Go CFD.
What key differences matter?
- Leverage boost: CFDs multiply returns 50x over unlevered ETFs, per broker data.
- Tax perks: CFDs avoid ETF capital gains distributions, saving 15-20% yearly.
- Flexibility: Short indices CFDs easily, unlike most ETFs’ long bias.
